Sea water temperature in the Canary Islands
31 July 2021
Python, matplotlib
Oceanography
Have you ever wondered where the water is the warmest around the Canary Islands? And what time of the year does it take place? This is what we want to show in this post!
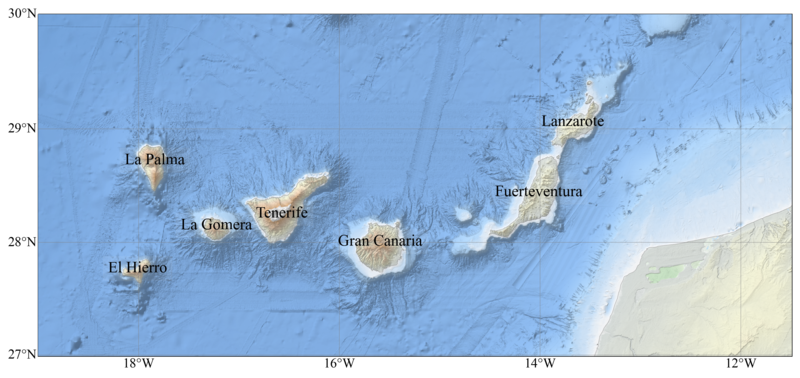
The Canary Islands
They are located approximately at a latitude of 28°N, west of Africa. Close to the African coast, the temperature is usually lower than the temperature offshore…
This is because of a process called upwelling: cooler water is brought to the surface because of the combined effect of the wind (Trade Winds here) and the Earth’s rotation.
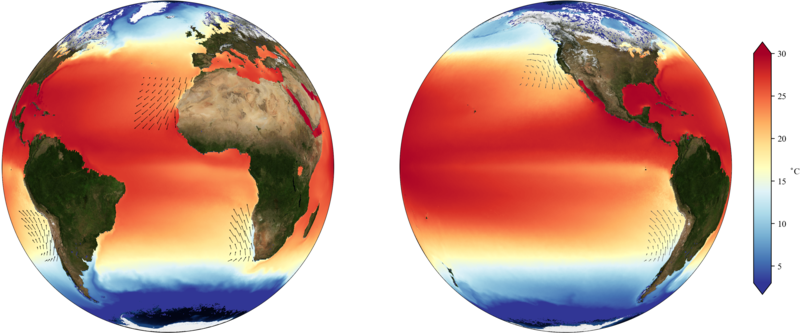
Upwelling also happens in other places of the world, for example California, Namibia/South Africa or Chile. Let’s come back to the Canary Islands.
Where and when can we find the highest (or lowest) sea water temperatures? To answer this question, we will use satellite measurements from the MODIS sensor on board Terra satellite. It provides data since 2000 till today. The data can be downloaded from the Ocean Color web, an excellent source of information.
For this study we take only the monthly average sea surface temperature (called SST), which means we have: February 2000, March 2000, April 2000, …, May 2021 (June is not ready yet). And for each month, we compute the spatial mean around the islands.
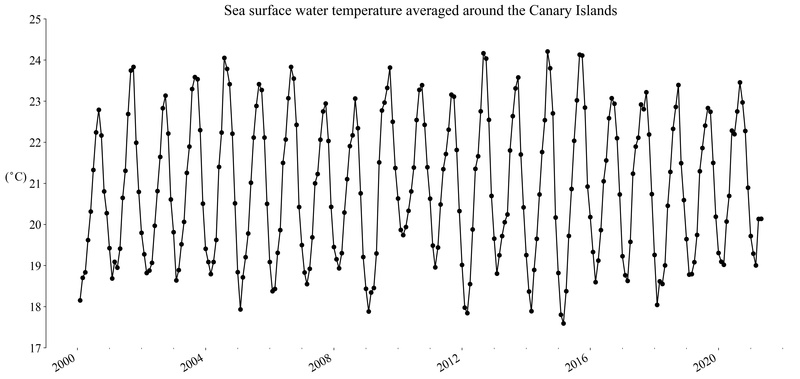
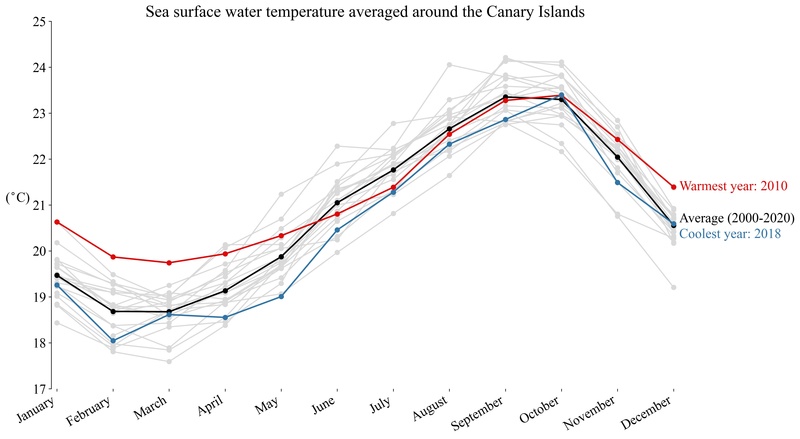
🌡️What we can see is that the mean temperature oscillates roughly between 18°C and 24°C, with some differences among the years.
Another way to present the same dataset is to overlay the 12 months, for each year.
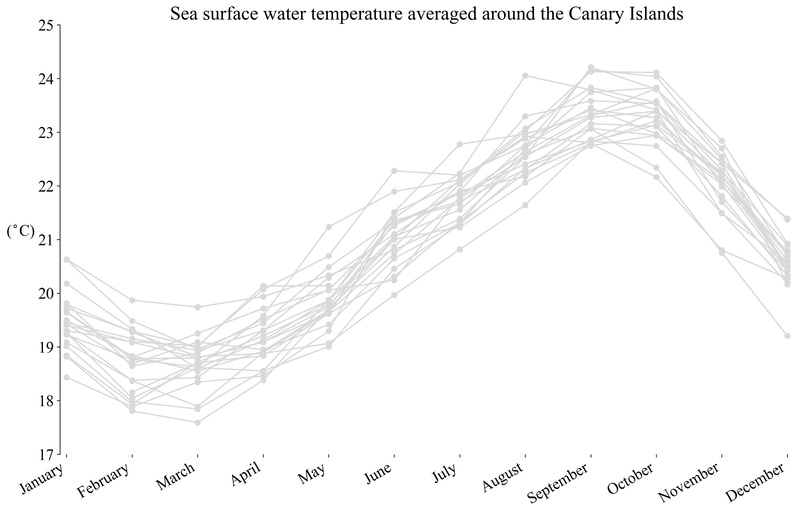
The coldest months are February and March and the warmest are September and October. Why is that? To explain it in simple terms:
In winter, the ocean does not receive a lot of energy from the atmosphere and the wind also contributes to the heat loss…
In summer, the maximal heat flux is in June/July, but this period has also rather strong winds, this is why the maximal temperatures usually happens later, when the wind relaxes and the ocean had time to warm up.
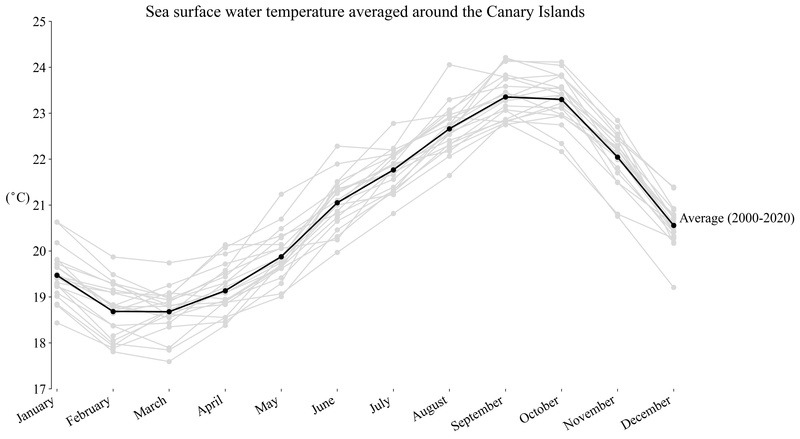
If we take the mean temperature for each month of the 2000-2020 period, we obtain the black line. It’s more or less what we can call a typical situation. Now let’s see when are the warmest and coldest years.
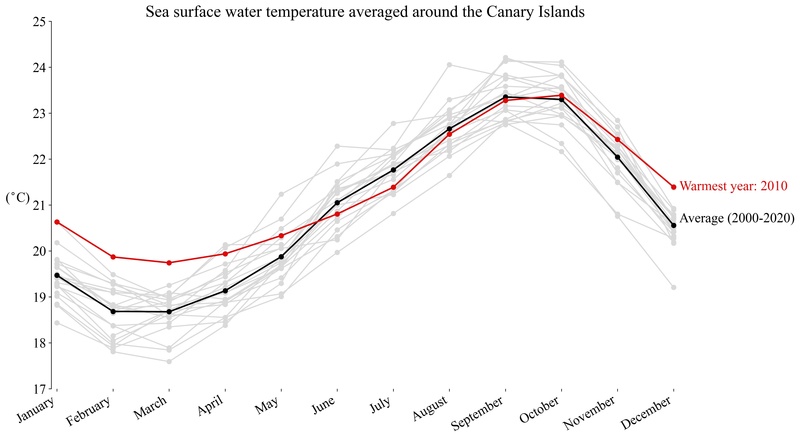
🌡️On average, 2010 was the warmest since 2000, specially because of the first months. The rest of the year was closer the average. What happened in 2010? The wind was much weaker in the area, so the upwelling was weaker, as well as the mixing of the water column.
The coolest year (also on average) was 2018. None of the 2018 months was particularly cold, except May, but almost all the months were below the average. What happened in 2018?? I don’t know, I’ve never checked, but if you have an idea, let us know!
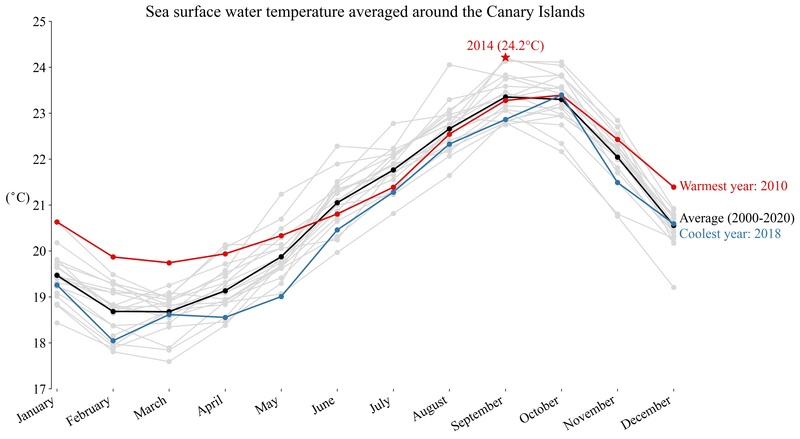
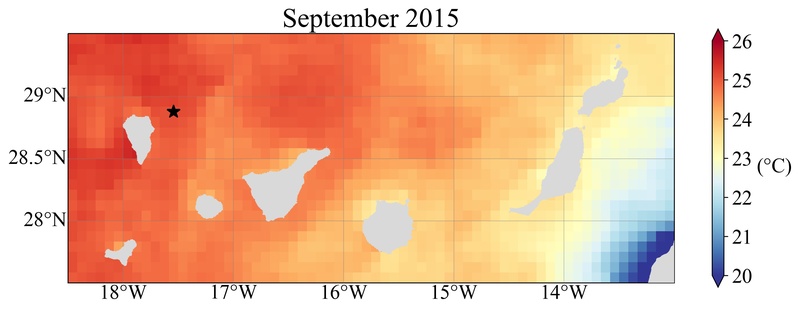
Now considering all the months since 2000, we see that September 2014 was the warmest, with an average of 24.2°C.
Of course this means that you can find places with higher temperatures, other with lower temperatures. But on average, that was the warmest month.
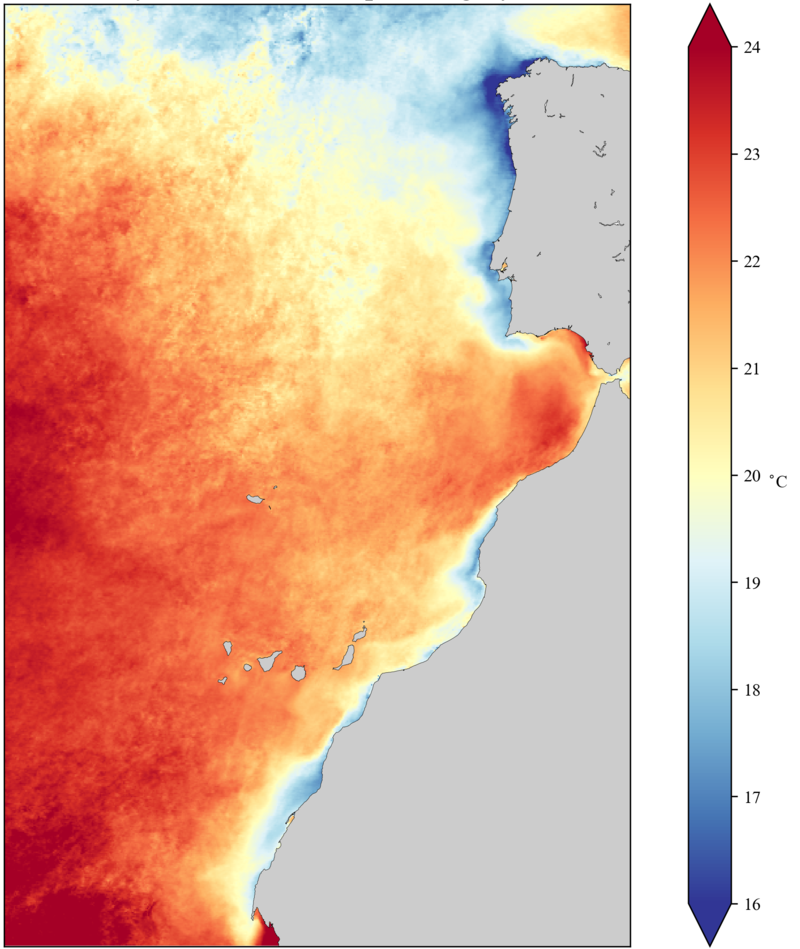
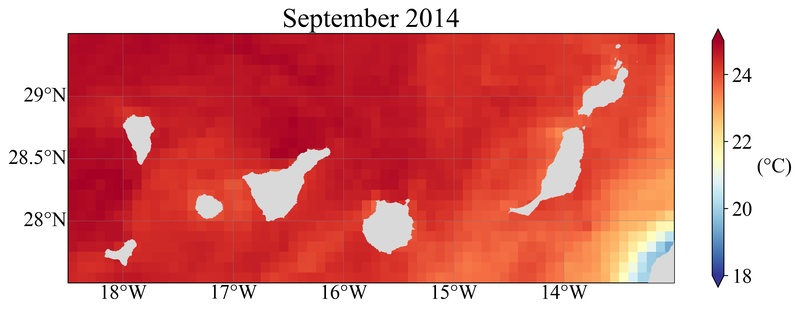
This is how September 2014 looked like. Several locations with temperature around 25°C. And the lowest values near the coast (remember the upwelling).
We can compare with a typical September situation (time average for the period 2000-2020).

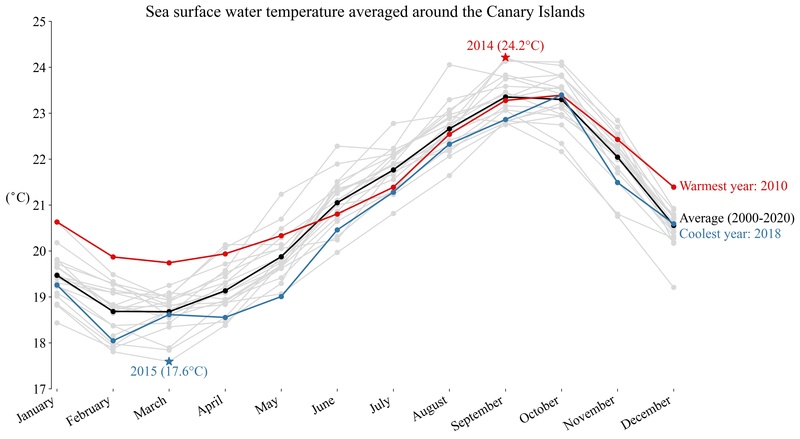
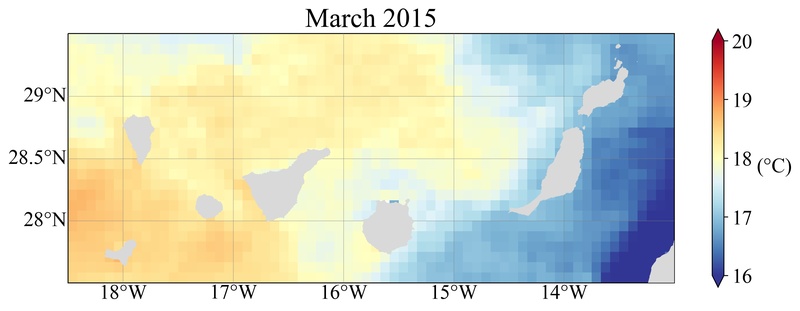
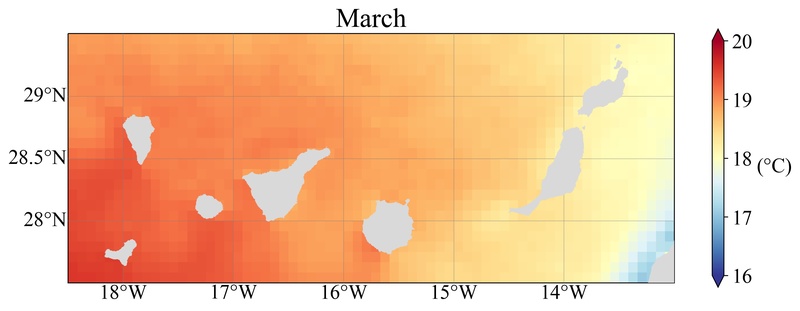
March 2015 was pretty cold, with an average of… 17.6°C! Maybe somebody remembers that month. From the map it is clear that the easternmost islands had lower temperatures than the rest of the archipelago. And again we compare with an average situation for a month of March.
If we don’t use spatial overage but search for the extreme temperatures, we get an absolute maximum of 25.6°C in September 2015 and a minimum of 15°C in May 2018.
End of the story?
I’m afraid no!
✅ We used monthly averages: some days in a given month will be warmer than others.
✅ During a given day, the temperature could be higher during daytime than nigh time.
✅ The dataset had a 9-km resolution…
Which means, if we use a higher spatial resolution, around 1 km for example, we see things not visible with the monthly average, 9-km resolution: eddies, filaments, island wakes…
I’m stopping now but hopefully I’ll continue this with other pieces of information concerning the water temperature.