Adding satellite wind on a visible image
26 September 2019
Python, Basemap, Cartopy
Oceanography, Maps, Wind, Satellite
How to create display wind vectors, measured by satellite, on top of true color image?
Data
We will play with:
- Visible images (geoTIFF) download from Sentinel-Hub or from WorldView.
- Level-2 (swath) wind data from MetOp-A and Metop-B, distributed by PO.DAAC (among others).
Metop is a series of meteorological satellites managed by EUMETSAT, the first one was launched in October 2010 and the most recent in November 2018.
Data reading
geoTIFF
We already showed how to get the coordinates from a geoTIFF, see for example this post.
The only thing we need to ensure is to download the image with the good projection (WGS 84).
Scatterometer wind
The wind fields are available as netCDF files from the JPL THREDDS data server.
Getting the wind intensity and direction is not a hard task, and converting to zonal and meridional components requires only a little bit of trigonometry (yes, sometimes people think nobody uses trigonometry after secondary school).
Still, there is a problem to solve: the wind files are organised by day of the year (1, 2, …, 365) and downloading all the files is not necessary since most of them have zero good measurements in the region of interest. This is easily solved using the OPeNDAP protocol, which allows us to get the variables we want without actually downloading the file. Then 2nd problem arises: to get the OPeNDAP URL, we need to know the file name, but its pattern does not allow us to construct it in an automatic way, as it depends on the time of acquisition.
For instance, one file corresponding to September 29, 2018, is named:
ascat_20180929_081200_metopa_61980_eps_o_coa_3201_ovw.l2.nc.gz
Of course there is a logic in the naming (year, month, day, hour, swath number…), but let’s say it’s not logic enough to code that in a few minutes.
This leads us to the other solution: reading the HTML from the THREDDS catalog index and extract from it the different file paths for the corresponding day. Luckily there is a library to do that in a few lines: BeautifulSoup: it makes it possible to parse the HTML and then get all the links in the document. I think people use it a lot when it comes to web scrapping.
Putting all the pieces together
With the data at hand, the plot is done in a couple of lines using the quiver() function (plot of vectors).
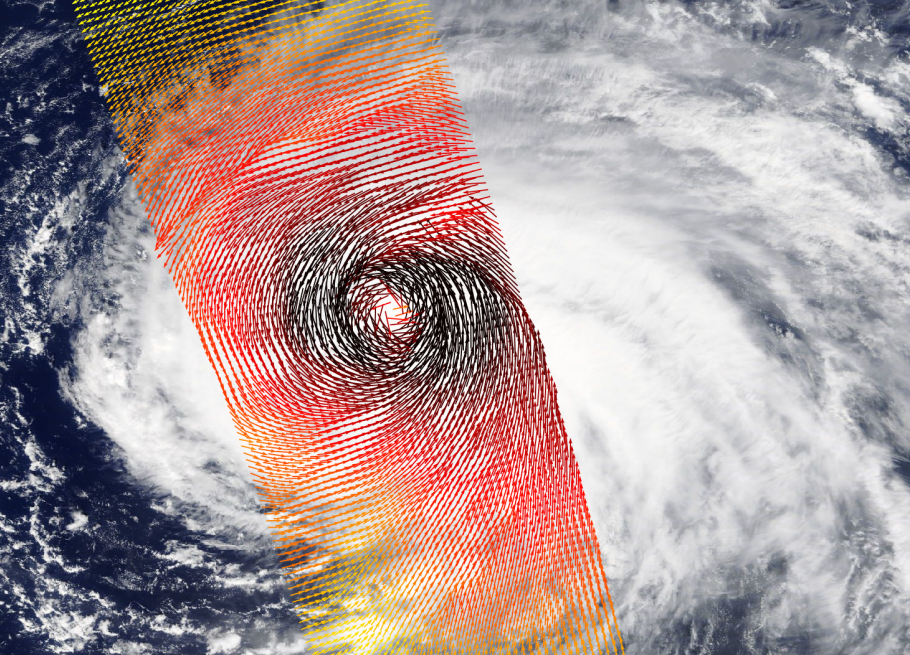
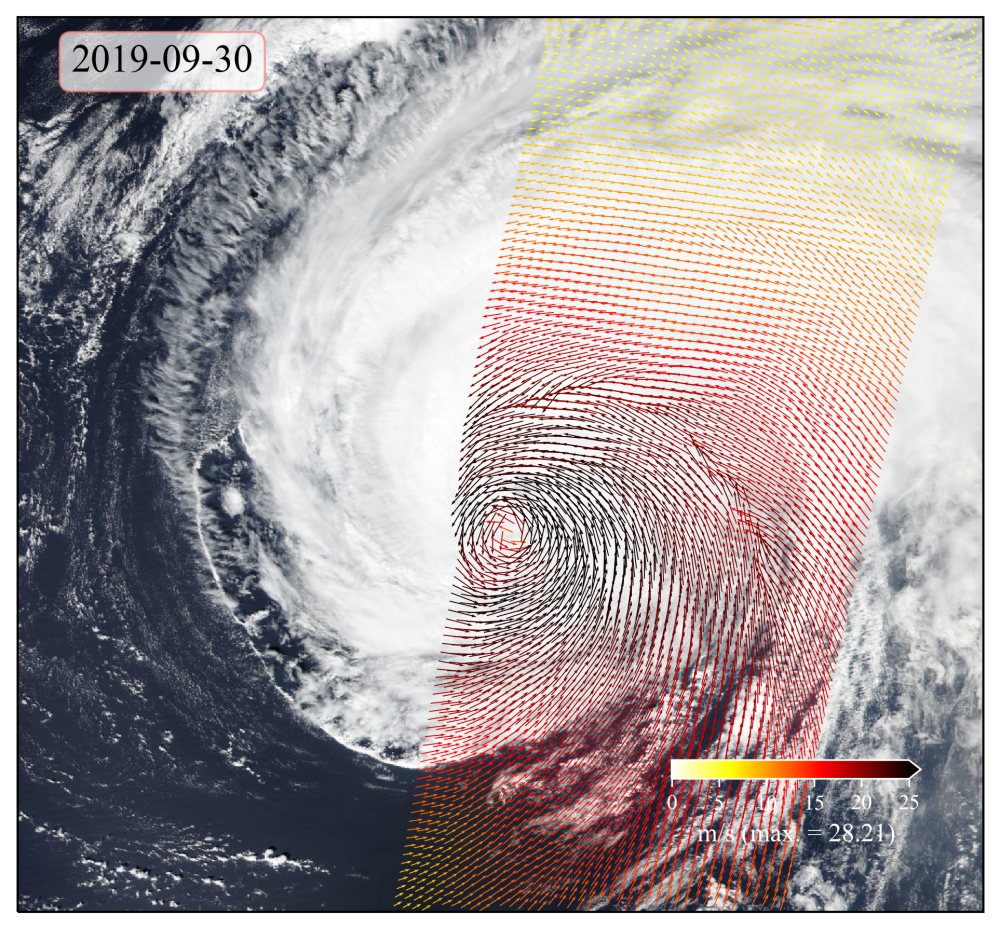
A color can be added to the arrows to depict the wind speed. The figure below provides an example with a tropical storm in the Atlantic Ocean on September 30, 2019. The visible image is taken from VIIRS (Visible Infrared Imaging Radiometer Suite).
Final drawback
The visible image and the winds are not necessarily acquired at the same time of the day, this can cause some discrepancies between the different layers of the images, for instance a storm that makes a long displacement, its center may not correspond to the center as depicted by the wind field.