Plotting a high-resolution coastline
02 September 2019
Python, Basemap, Cartopy
Oceanography, Maps
How can we obtain the finest coastline for a regional plot?
This is what we will show here.
import matplotlib.pyplot as plt
from mpl_toolkits.basemap import Basemap
import cartopy
import cartopy.crs as ccrs
import cartopy.feature as cfeature
Let’s define our domain: here we will work with the Bay of Calvi (Corsica, France).
We create a variable coordinates that will store the min/max longitudes/latitudes.
coordinates = (8.7, 8.81, 42.55, 42.60)
Basemap
Let’s work with the Mercator projection.
With the Global Self-consistent, Hierarchical, High-resolution Geography Database (GSHHG), 5 resolutions are available:
resolutions = {"c": "crude",
               "l": "low",
               "i": "intermediate",
               "h": "high",
               "f": "full"}
We can display the different coastlines:
fig = plt.figure(figsize=(8, 6))
for i, res in enumerate(resolutions):
    m = Basemap(projection='merc',
        llcrnrlon=coordinates[0], llcrnrlat=coordinates[2],
        urcrnrlon=coordinates[1], urcrnrlat=coordinates[3],
        resolution=res)
    proj_list.append(m)
    ax = plt.subplot(2, 3, i+1)
    m.drawcoastlines(linewidth=.5)
    plt.title(resolutions[res], fontsize=14)

plt.show()
plt.close()
The crude resolution is so low that we can’t even see the coast.
The full resolution provides a good amound of details that is sufficient in most of the situations.
Cartopy
Coastline from Natural Earth
With the function coastlines(), we can draw a coastline using the Natural Earth dataset at 110 m, 50 m or 10 m resolution.
myproj = ccrs.PlateCarree()
plt.figure(figsize=(10, 3))
ax = plt.subplot(131, projection=myproj)
ax.coastlines(resolution='110m')
ax.set_xlim(coordinates[0], coordinates[1])
ax.set_ylim(coordinates[2], coordinates[3])
plt.title("110 m")

ax = plt.subplot(132, projection=myproj)
ax.coastlines(resolution='50m')
ax.set_xlim(coordinates[0], coordinates[1])
ax.set_ylim(coordinates[2], coordinates[3])
plt.title("50 m")

ax = plt.subplot(133, projection=myproj)
ax.coastlines(resolution='10m')
ax.set_xlim(coordinates[0], coordinates[1])
ax.set_ylim(coordinates[2], coordinates[3])
plt.title("10 m")

plt.suptitle("Natural Earth")
plt.show()
plt.close()
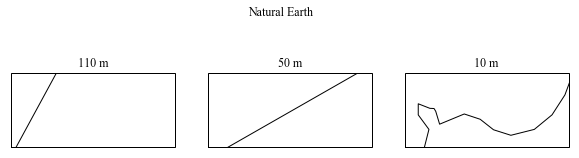
Even at 10 m, the result is not good enough.
GSHHG
Let’s try to use again the GSHHG, also accessible from Cartopy.
We start with a Plate-Carrée projection.
myproj = ccrs.PlateCarree()
fig = plt.figure(figsize=(8, 4))
for i, res in enumerate(resolutions):#, "h", "f"):
    ax = plt.subplot(2, 3, i+1, projection=myproj)
    coast = cf.GSHHSFeature(scale=res)
    ax.add_feature(coast)
    ax.set_xlim(coordinates[0], coordinates[1])
    ax.set_ylim(coordinates[2], coordinates[3])
    plt.title(resolutions[res])
plt.suptitle("GSHHS")
plt.show()
plt.close()
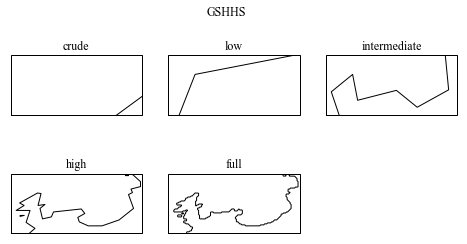
The full resolution product displays a lot of details, more than with Basemap.
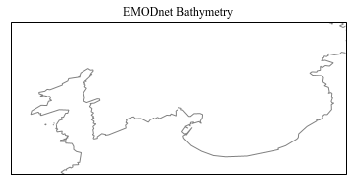
EMODnet Bathymetry
If we’re working on a European Sea or region, EMODnet is a good option.
Instead of downloading the product, we can access it through the Web Map Service (WMS).
This Cartopy example is particularly relevant.
myproj = ccrs.PlateCarree()
fig = plt.figure(figsize=(6, 6))
ax = plt.subplot(111, projection=myproj)
ax.add_wms(wms='http://ows.emodnet-bathymetry.eu/wms',
               layers=['coastlines'])
ax.set_xlim(coordinates[0], coordinates[1])
ax.set_ylim(coordinates[2], coordinates[3])
plt.title("EMODnet Bathymetry")
plt.savefig("./coastline_emodnet", dpi=300, bbox_inches="tight")
plt.show()
plt.close()
Comparison
myproj = ccrs.PlateCarree()
fig = plt.figure(figsize=(6, 10))
ax = plt.subplot(311)
m.drawcoastlines(linewidth=1)
plt.title(resolutions[res], fontsize=14)
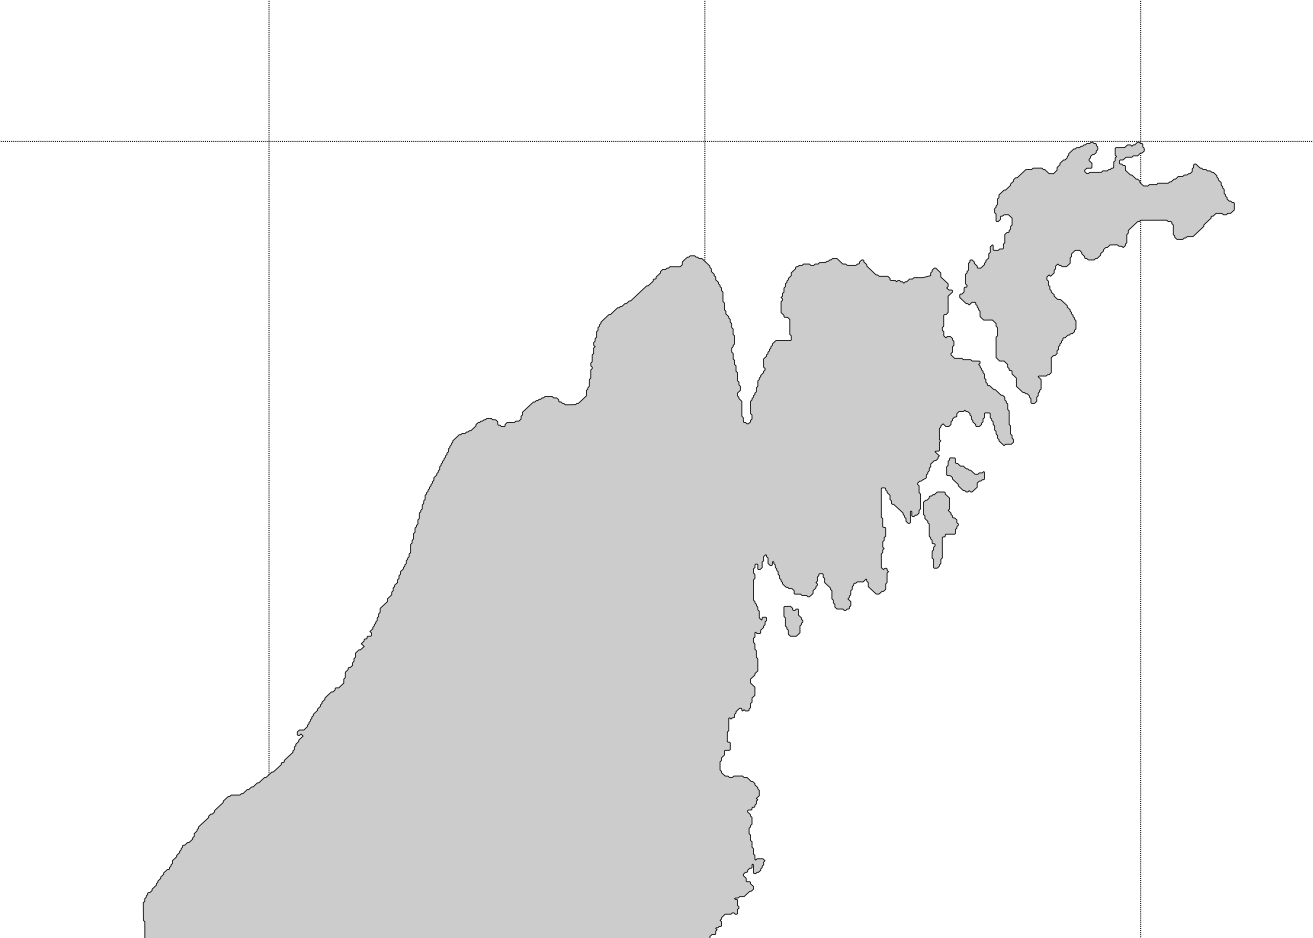
plt.title("Basemap: GSHHS (full resolution)")
ax = plt.subplot(312, projection=myproj)
coast = cf.GSHHSFeature(scale=res)
ax.add_feature(coast)
ax.set_xlim(coordinates[0], coordinates[1])
ax.set_ylim(coordinates[2], coordinates[3])
plt.title("Cartopy: GSHHS (full resolution)")
ax = plt.subplot(313, projection=myproj)
ax.add_wms(wms='http://ows.emodnet-bathymetry.eu/wms',
layers=['coastlines'])
ax.set_xlim(coordinates[0], coordinates[1])
ax.set_ylim(coordinates[2], coordinates[3])
plt.title("Cartopy: EMODnet Bathymetry WMS")
plt.show()
plt.close()
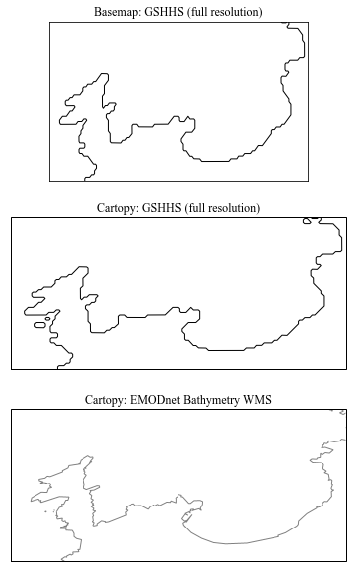
EMODnet Bathymetry offers the best resolution for the coastline.