Mallorca Airbnb revisited
18 February 2019
Python - Leaflet - javascript
Not so long ago I was thinking about the Airbnb story in Mallorca: in summary, (some) people were buying houses and apartments to later rent them to tourists on Airbnb. As a result, prices were rising and the locals, i.e., the people living there for longer periods, could not afford to rent a flat.
What’s funny here is that most of the people and travelers I know think that Airbnb is the coolest way to spend a few nights somewhere, because they can get to know local people and live in a real house. My experience is rather limited for the reasons mentioned before, but I could say that Airbnb is a mix of different situations (simplifying…):
- the owner is a cool person that helps you a lot and takes care of the details, usually he or she has only one property, and that contributes to reach the end of the month.
- the owner replies to emails and phone calls, but you never manage to see them. Maybe too busy with their many clients.
Anyway, we make our own decision based on the information we have, and having no information about a topic may be itself a decision. Well, all that to explain that I wanted to see how the number of properties offered by Airbnb evolved in the different municipalities of the island, as already shown in a previous post.
Getting the data
The best source is Inside-Airbnb, which provides csv files with all the information one might wish to perform analysis. I ended up with the files named listings20170315.csv and listings20181108.csv.
The file content looks like this:
id,name,host_id,host_name,neighbourhood_group,neighbourhood,latitude,longitude,room_type,price,minimum_nights,number_of_reviews,last_review,reviews_per_month,calculated_host_listings_count,availability_365
11547,My home at the beach,42942,Daniel,,Calvià,39.51888263030777,2.481824204366587,Entire home/apt,70,6,83,2018-11-01,0.94,1,211
100831,HOUSE IN MALLORCA - WiFi(ET-3045),529151,Miguel,,Santa Margalida,39.76346803718038,3.162551245945415,Entire home/apt,160,7,17,2018-09-20,0.19,1,312
105891,VILLAGE HOUSE WITH POOL: IDEAL FOR FAMILIES,549192,Bartomeu,,Maria de la Salut,39.66043828082695,3.0716464000735644,Entire home/apt,90,7,10,2018-09-02,0.13,2,260
...
Out of that I’m particularly interested in the latitudes and longitudes or, equivalently, the neighborhood.
I must also say that having the data in such a format is rather cool, it means it’s not necessary to start writing parsing functions and playing with exceptions, which is quite common with the field I’m working.
Processing
There is not a lot to say: we start with a geoJSON file containing all the municipalities of the island and for each municipality, we add a property storing the relative increase of rooms available. One field of the geoJSON can be similar to this:
{"type": "FeatureCollection",
  "features": [{"type": "Feature", "id": 7604,
    "properties": {"ID_0": 215, "ISO": "ESP", "NAME_0": "Spain", "ID_1": 13, "NAME_1": "Islas Baleares", "ID_2": 44, "NAME_2": "Baleares", "ID_3": 324, "NAME_3": "n.a. (54)", "ID_4": 7605, "NAME_4": "Art\u00e0", "VARNAME_4": "Art\u00e1", "CCN_4": 0, "CCA_4": "", "TYPE_4": "Municipality", "ENGTYPE_4": "Municipality", "habitants": 7448.0, "rooms": 302, "increase": 0.12582781456953643, "rooms2016": 302, "rooms2018": 340, "roomsPerHabitants": 40.55},
    "geometry": {"type": "Polygon",
      "coordinates": [[[3.420972108840999, 39.75159072875988], [3.419806957244987, 39.750217437744254], [3.415091037750244, 39.74511337280285], [3.413971900939998, 39.731700897216854], [3.409914970398063, 39.72647094726574]]]}
}
At this stage there is not a lot more left to do, except using Leaflet and creating a style function to assign a color to each municipality according to the selected property.
Results
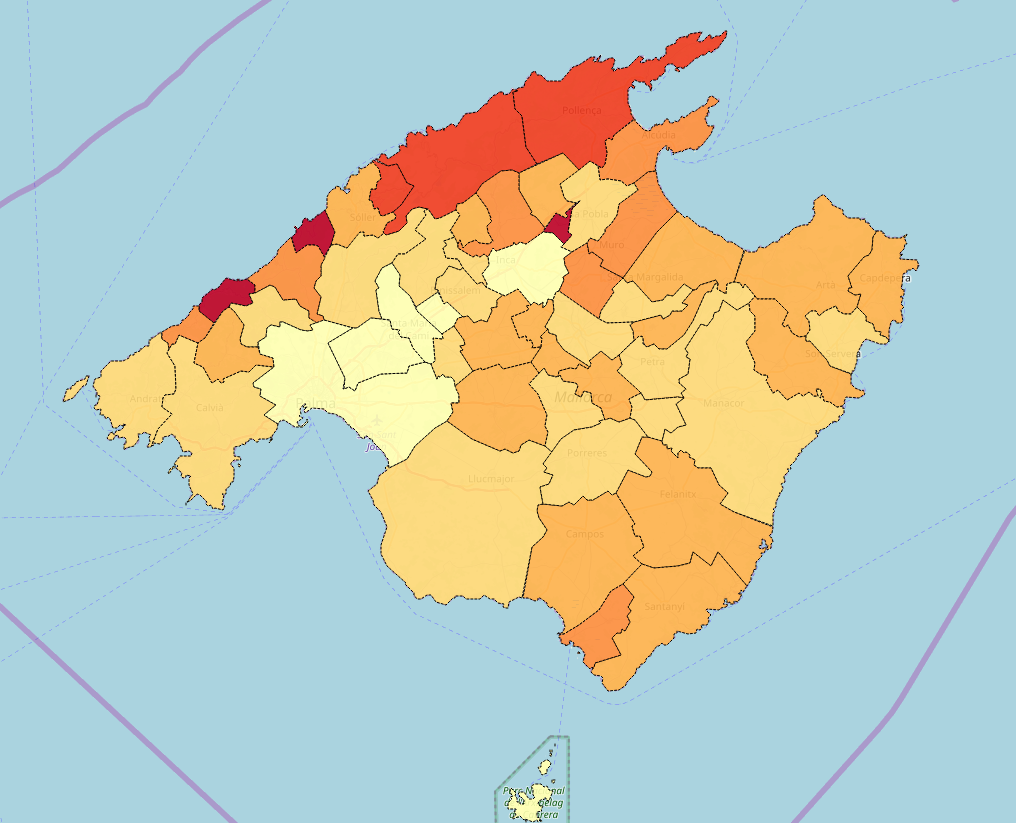
The interactive map is available here.
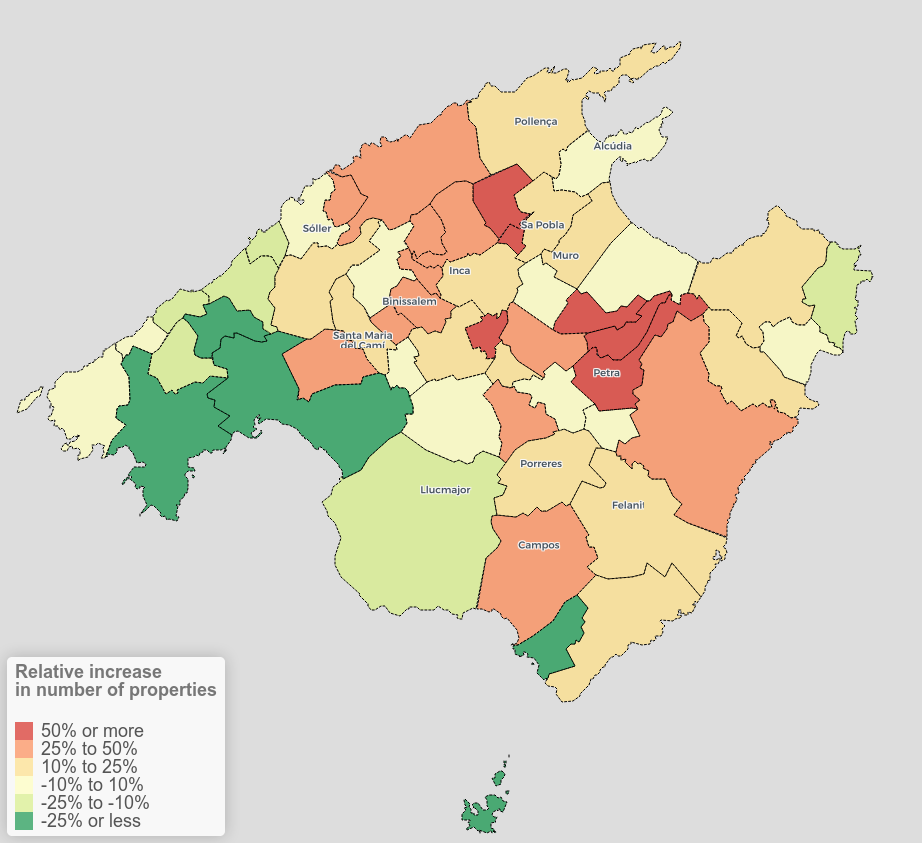
Interesting features are:
- the decrease of available rooms around Palma (Esporles, Valldemossa, Llucmajor). Keep into account that at the scale of the island, the decrease taking place in Palma has a large influence.
- overall, most of the municipalities underwent an increase, even for some of them it means only a few properties more.
- 6 municipalities have seen their Airbnb properties increase for more than 50%: Campanet, Búger, Costix, Maria de la Salut, Ariany and Petra, with a tremendous increase of 104.8%.
The question is: why in these places? My 2-cent answer would be a combination of 2 factors:
- some villages have many empty houses because people prefer to live closer to Palma or Inca, so it’s easier and cheaper to prepare the houses and rent rooms there.
- their is a large community of cyclists from northern Europe coming to ride in Mallorca, not only in summer but already from March on. A lot of bars and restaurants are bike friendly, with specific menus (maybe) and structures to attach the bikes to.
Future work
Here the analysis is really limited to the decrease/increase by municipality but one can be tempted to have a look at another scale (neighbourhood of Palma for example) and also the check if there is a creation/destruction process of Airbnb accommodations across the island.