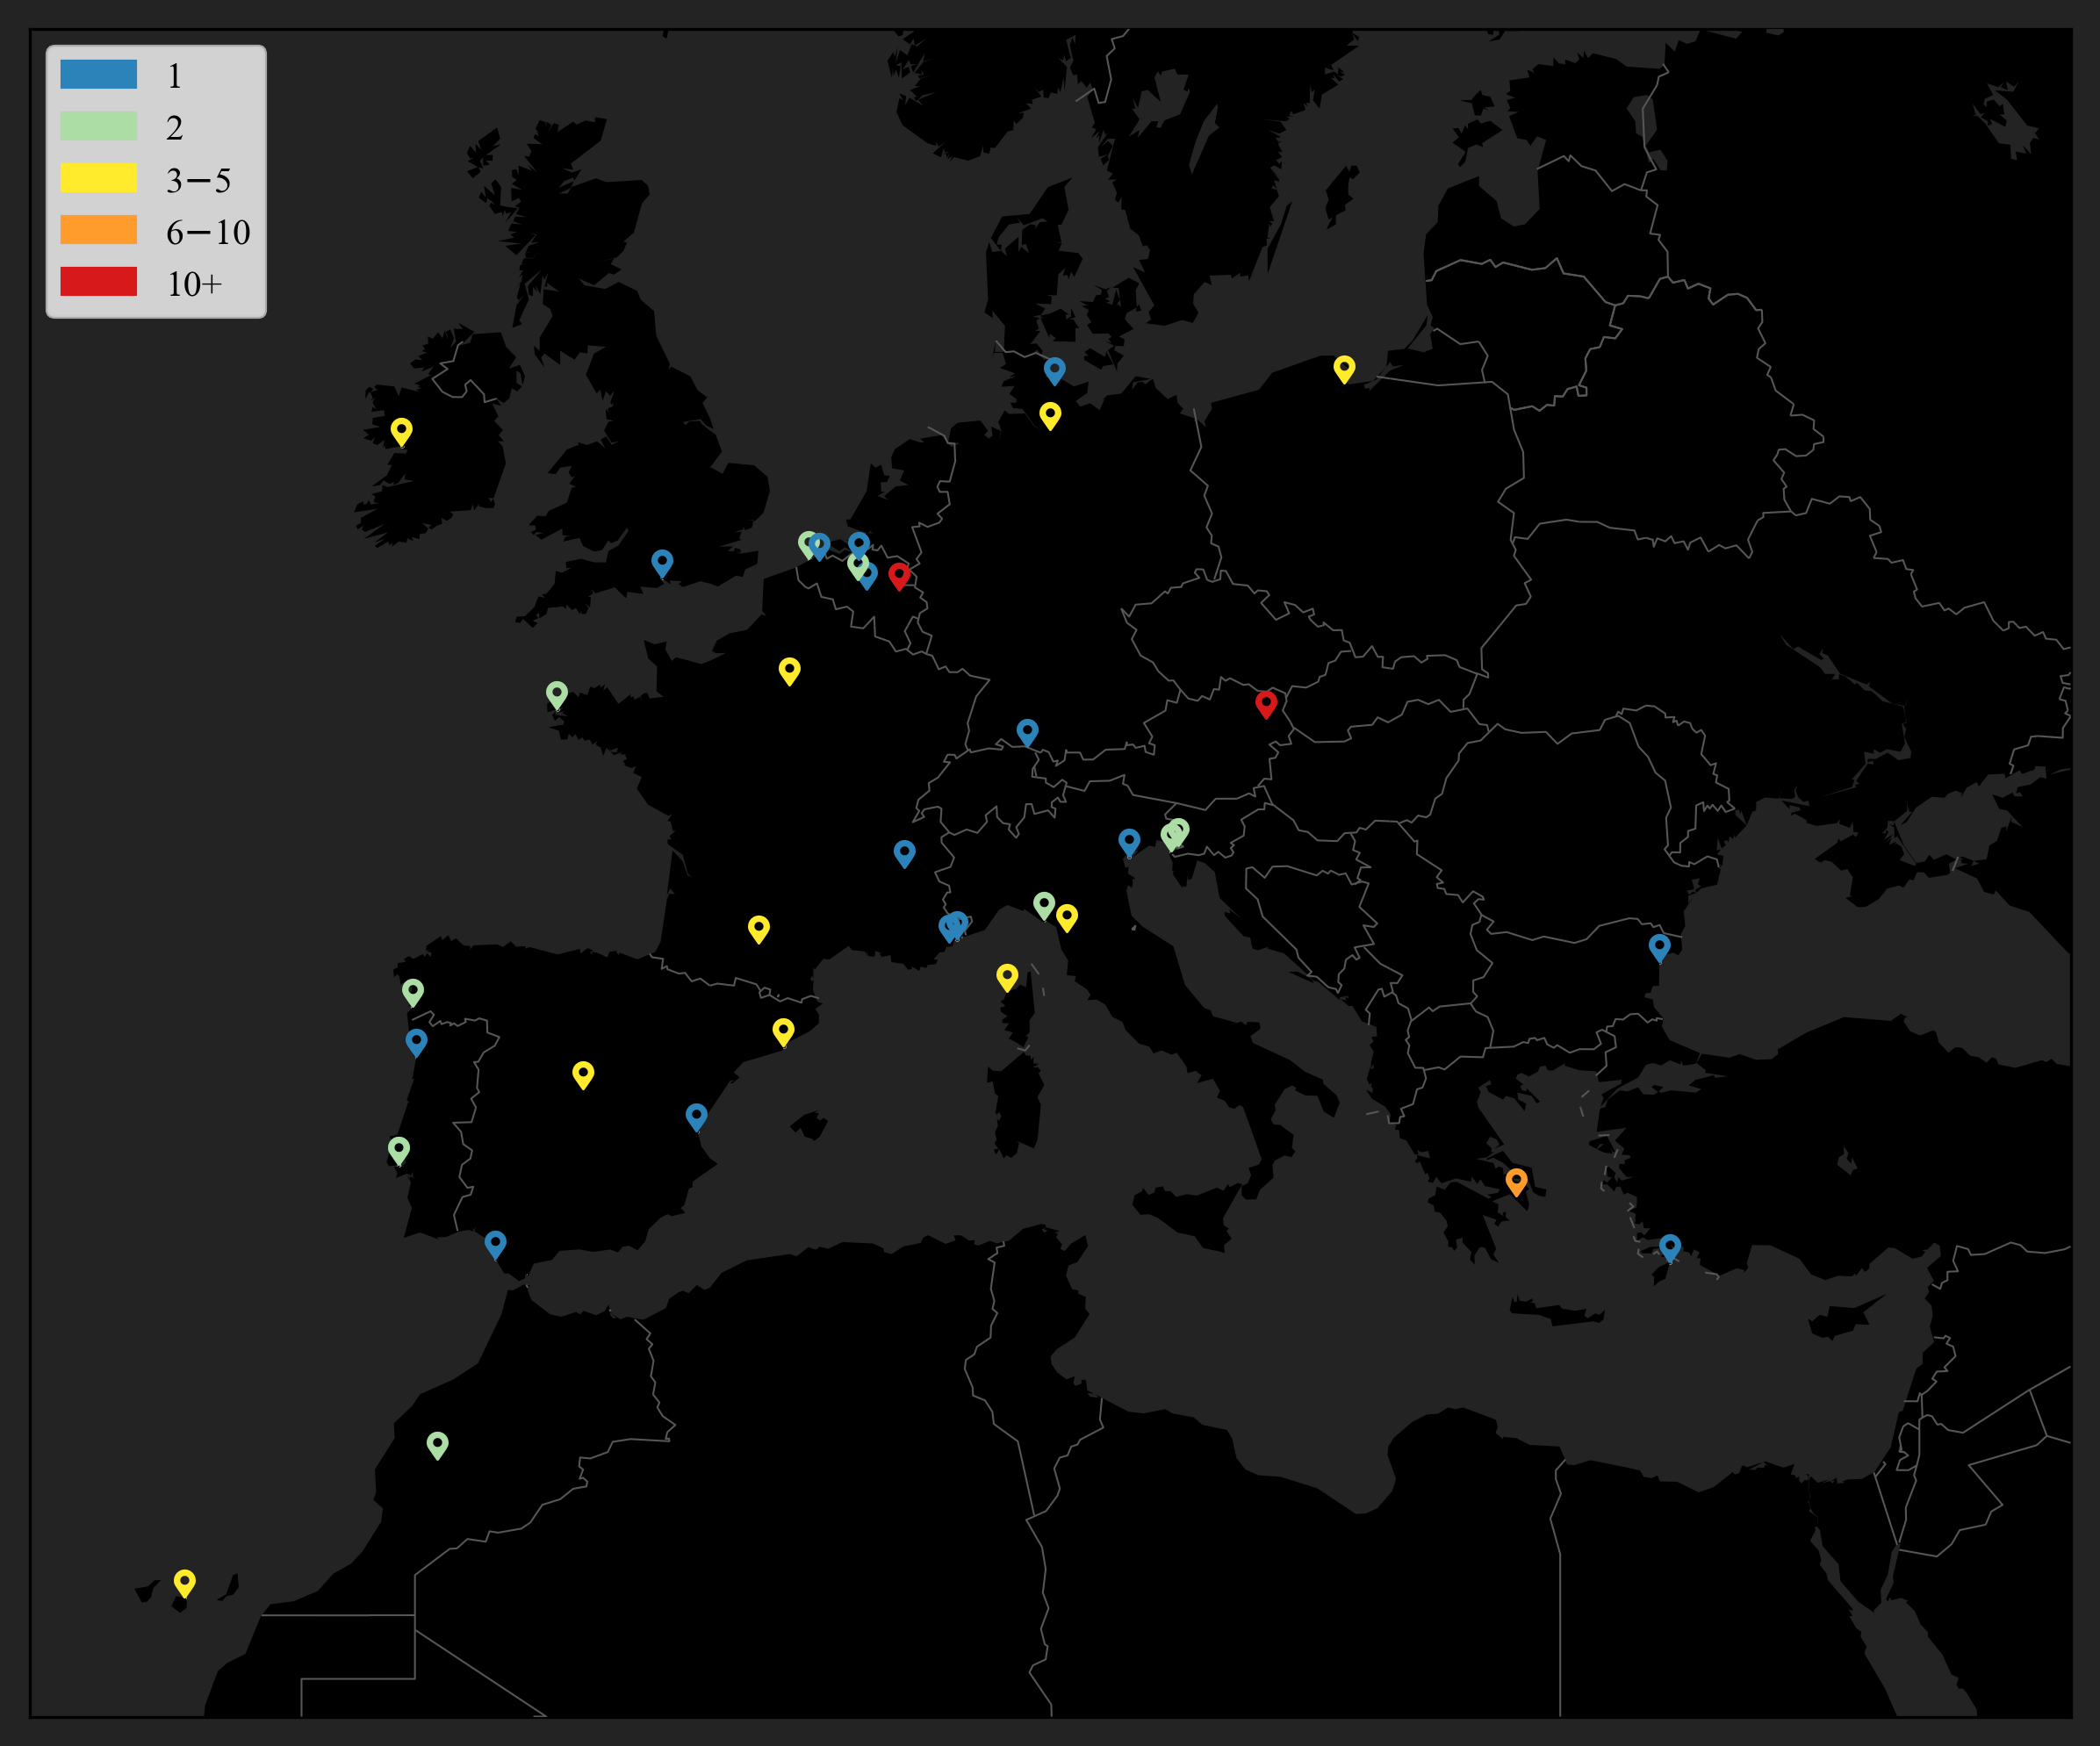
Conference participation map
03 January 2019
Python - Basemap - fontawesome
Not so long ago I had to update and check my list of publications and conferences (everything is stored in BibTex format and versioned using GitHub), and I had to idea to turn that information into a simple map. The good thing is that the procedure is really to repeat with other BibTeX files, provided the information concerning the place of the conferences (town, country) is provided.
Tools
- For the data parsing, it was easy to find the
bibtexparser. - To get the coordinates from the address (town + country), we use
geopy - For the visualisation,
matplotlib+Basemapis the right combo.
Code
Again, nothing fancy: we open the file storing the conference info and read its content:
with open(bibtex_file) as f:
    bib_database = bibtexparser.load(bibtex_file)
Then we can loop on the reference and get the address field:
for conf in bib_database.entries:
    address = conf["address"]
    ...
and from the address we can get the coordinates for the plot:
from geopy.geocoders import Nominatim
geolocator = Nominatim()
location = geolocator.geocode(address, timeout=20)
For the plot it was slightly tricky to get the fontawesome icons correctly and to have the desired colorbar, but at the end it worked as expected: the markers are colored according to the number of times a conference was attended in a given place.
Source
A jupyter notebook showing the whole code available: conference_map.ipynb.