Velocity field from high-frequency radar
01 October 2017
Python (matplotlib)
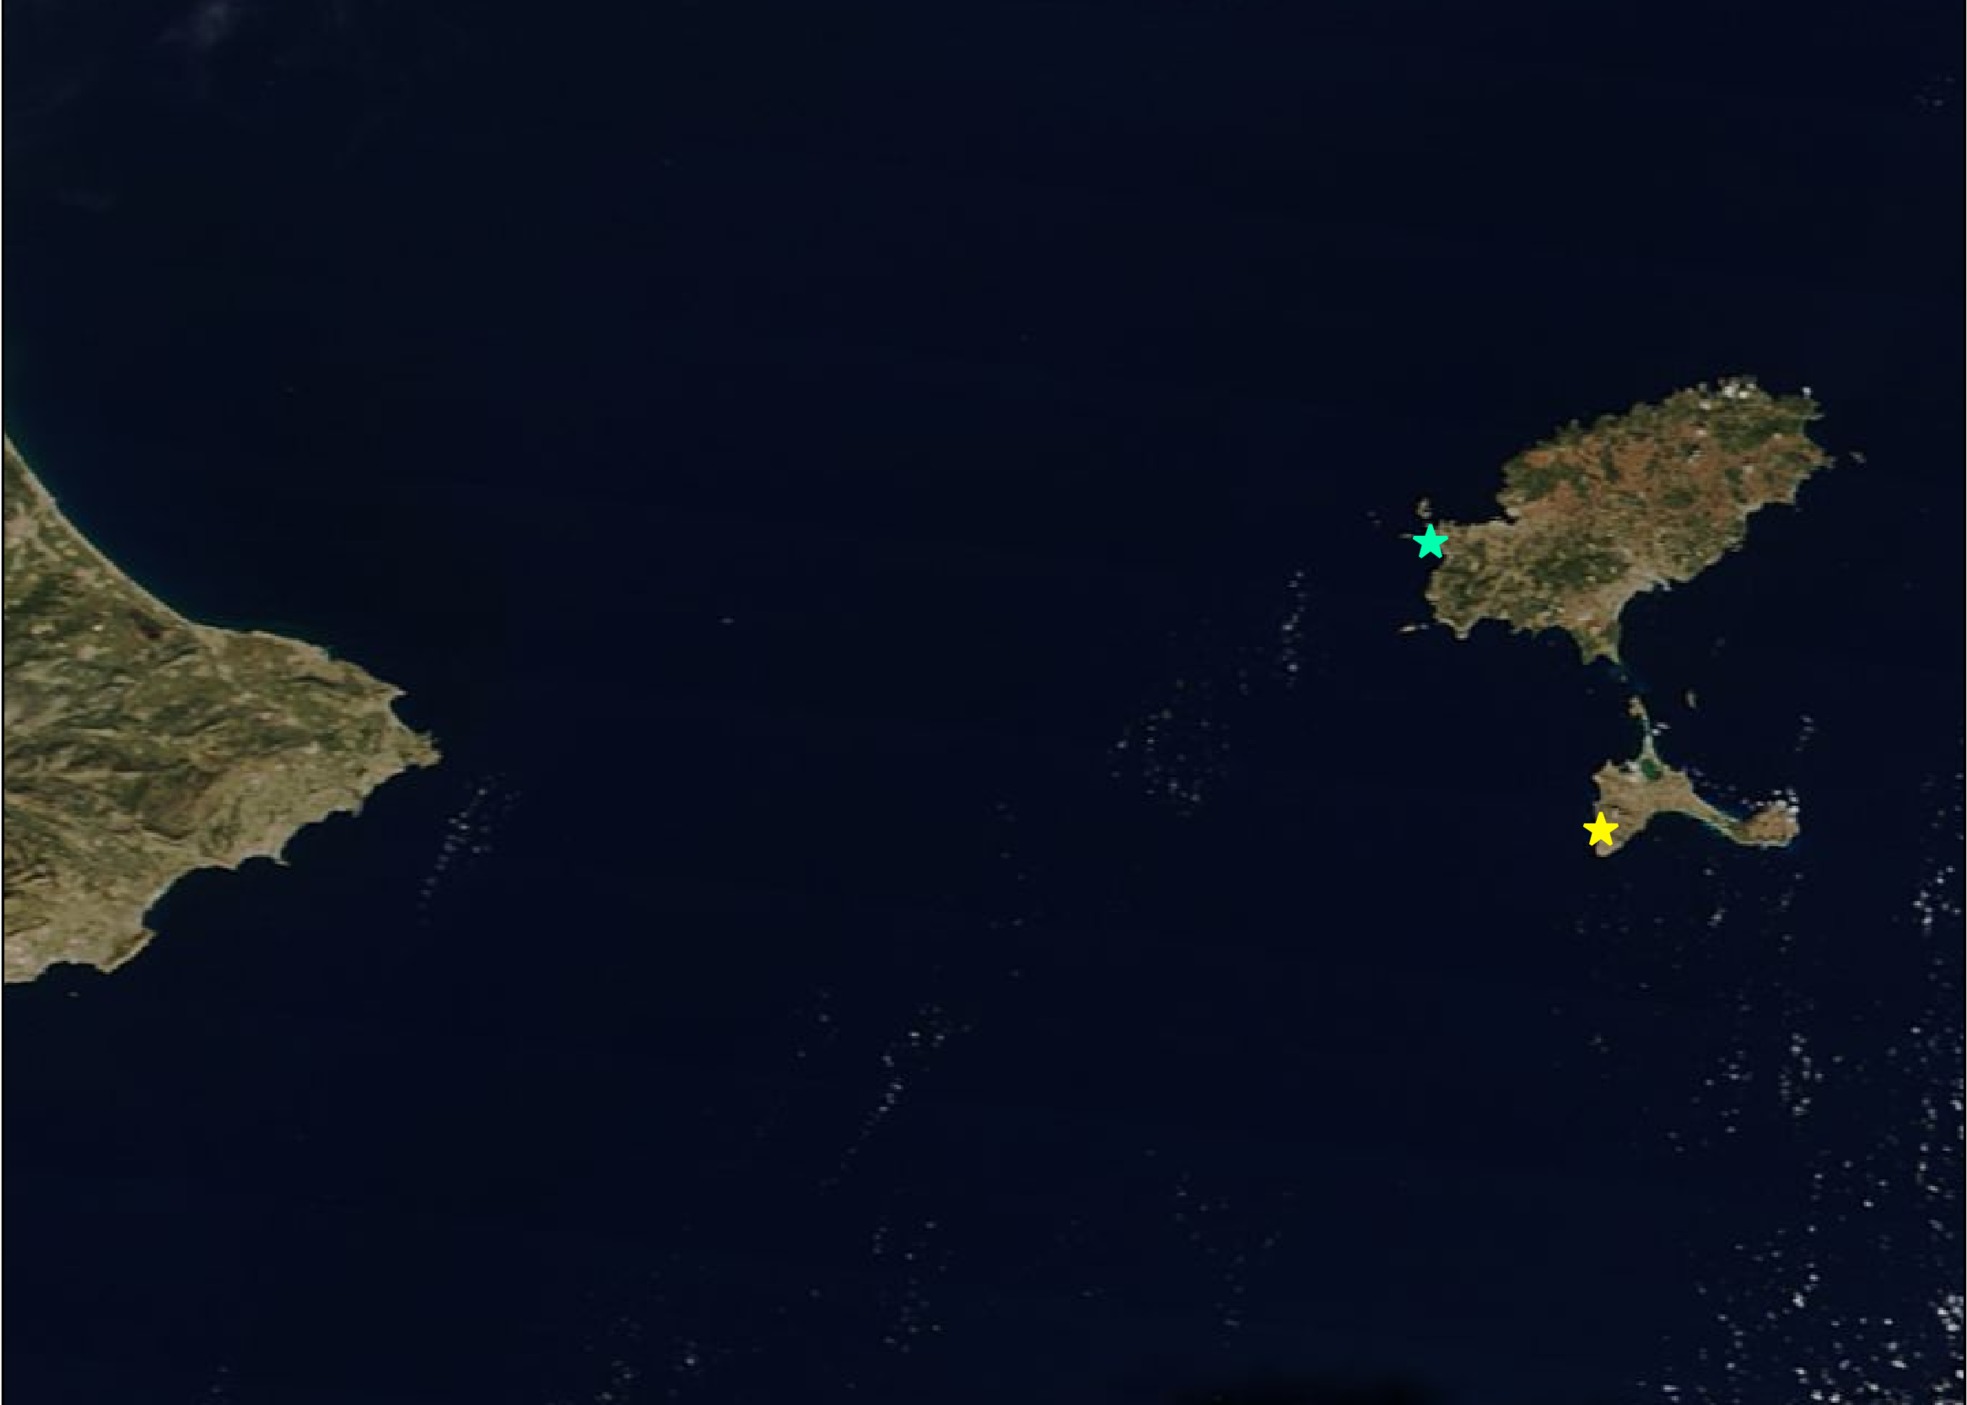
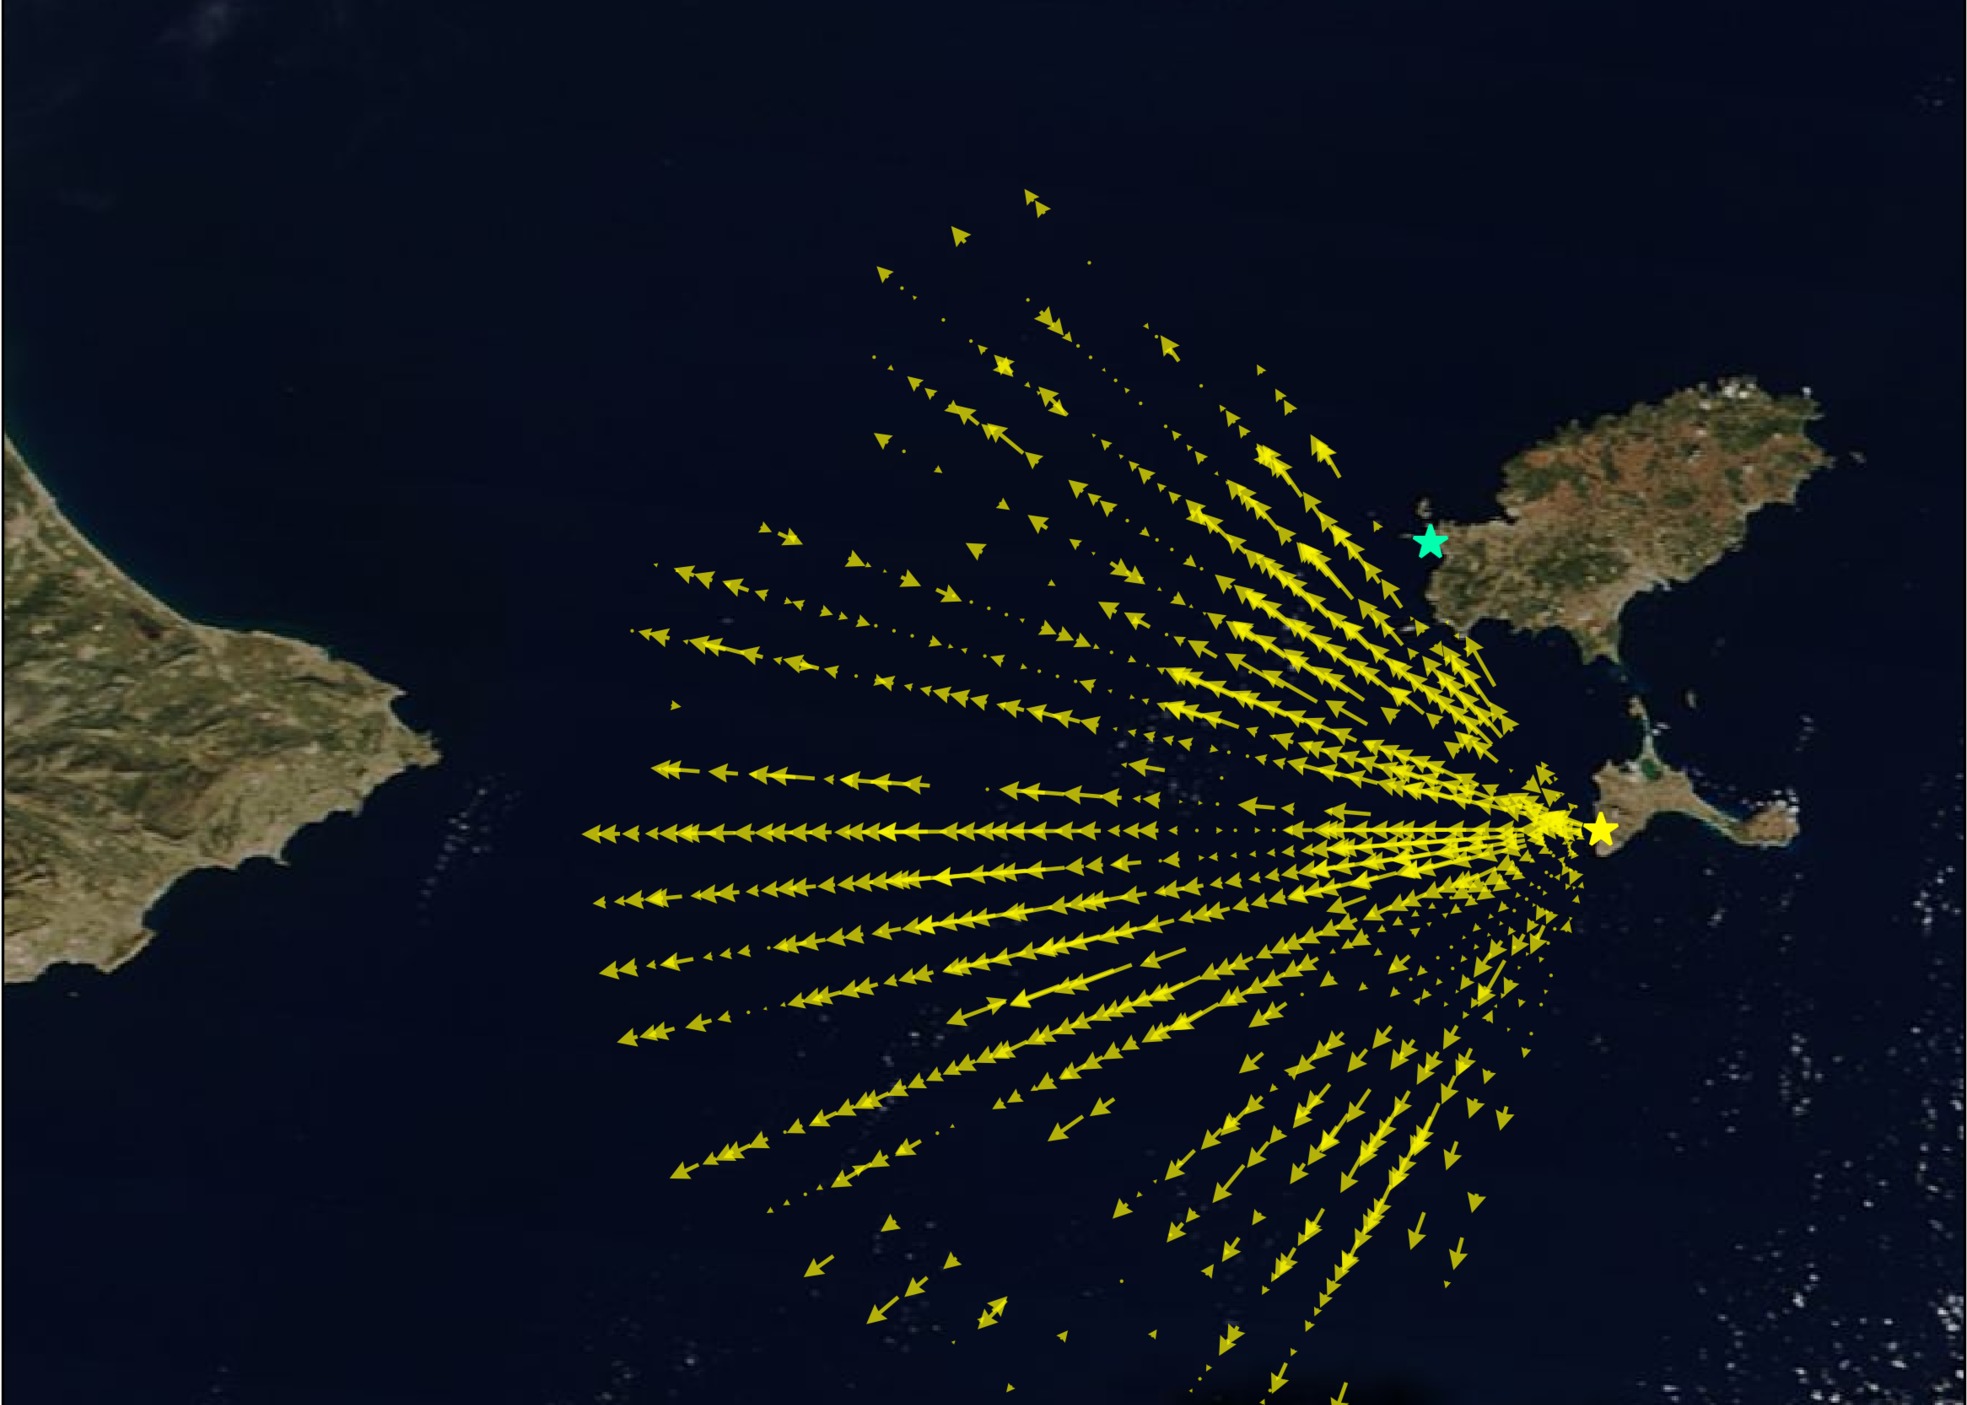
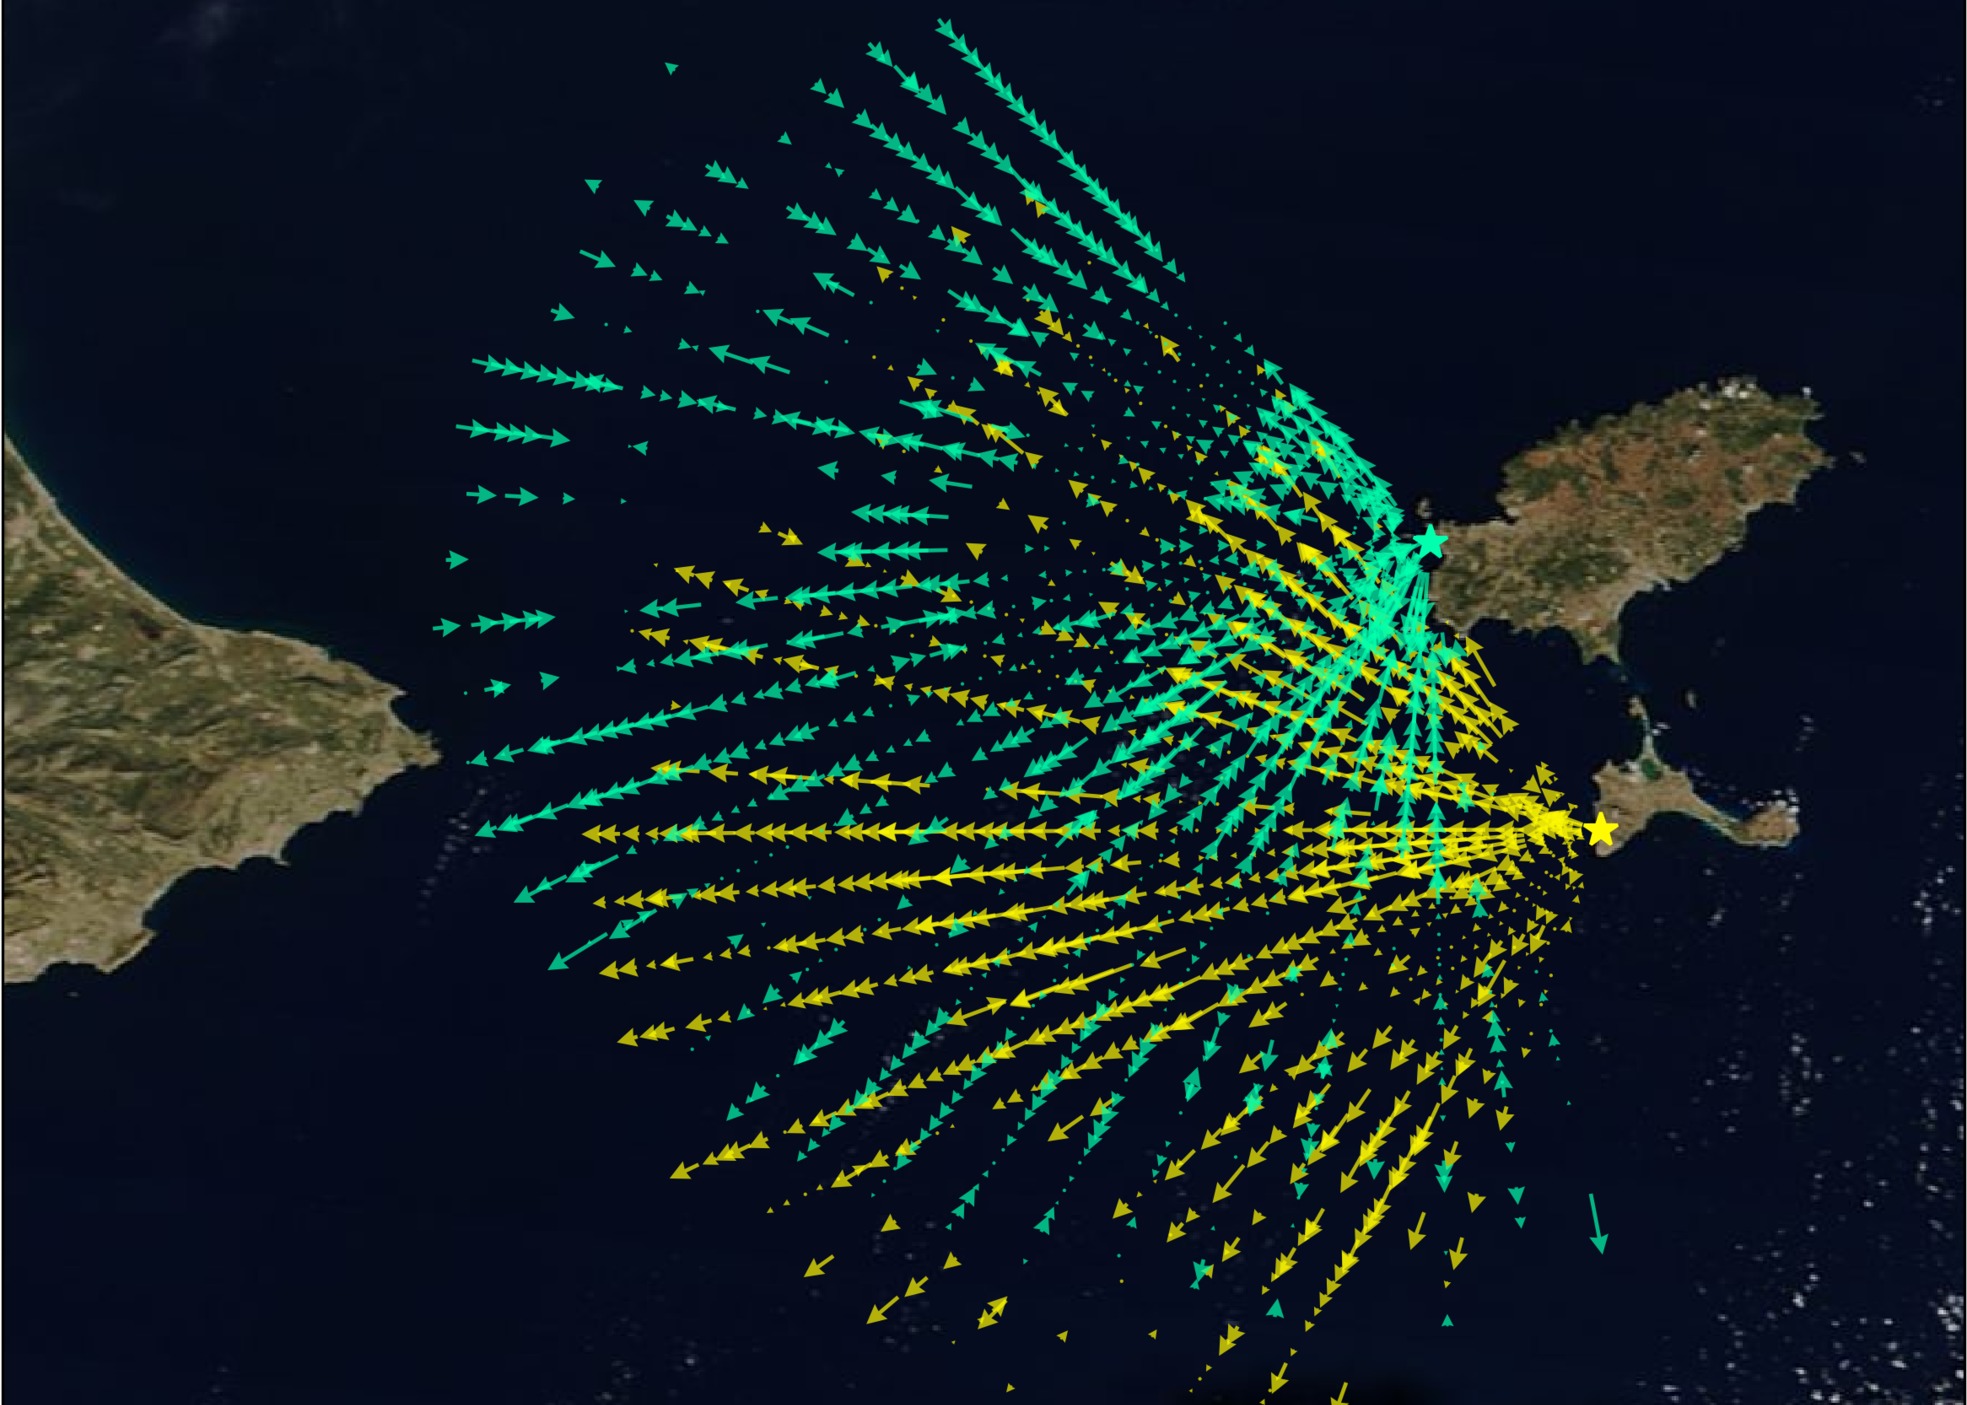
In order to illustrate the derivation of HF radar total velocities from the radials obtained at different sites, we prepared a step-by-step animation.
Concept
It is always easier to explain complex systems by progressively increasing the quantity of information in the figure.
Realization
Data are obtained from the SOCIB. The green and yellow arrows are the radial velocities from Galfi (on Ibiza island) and Formentera sites, respectively. The while arrows are the total velocities derived from the radials.
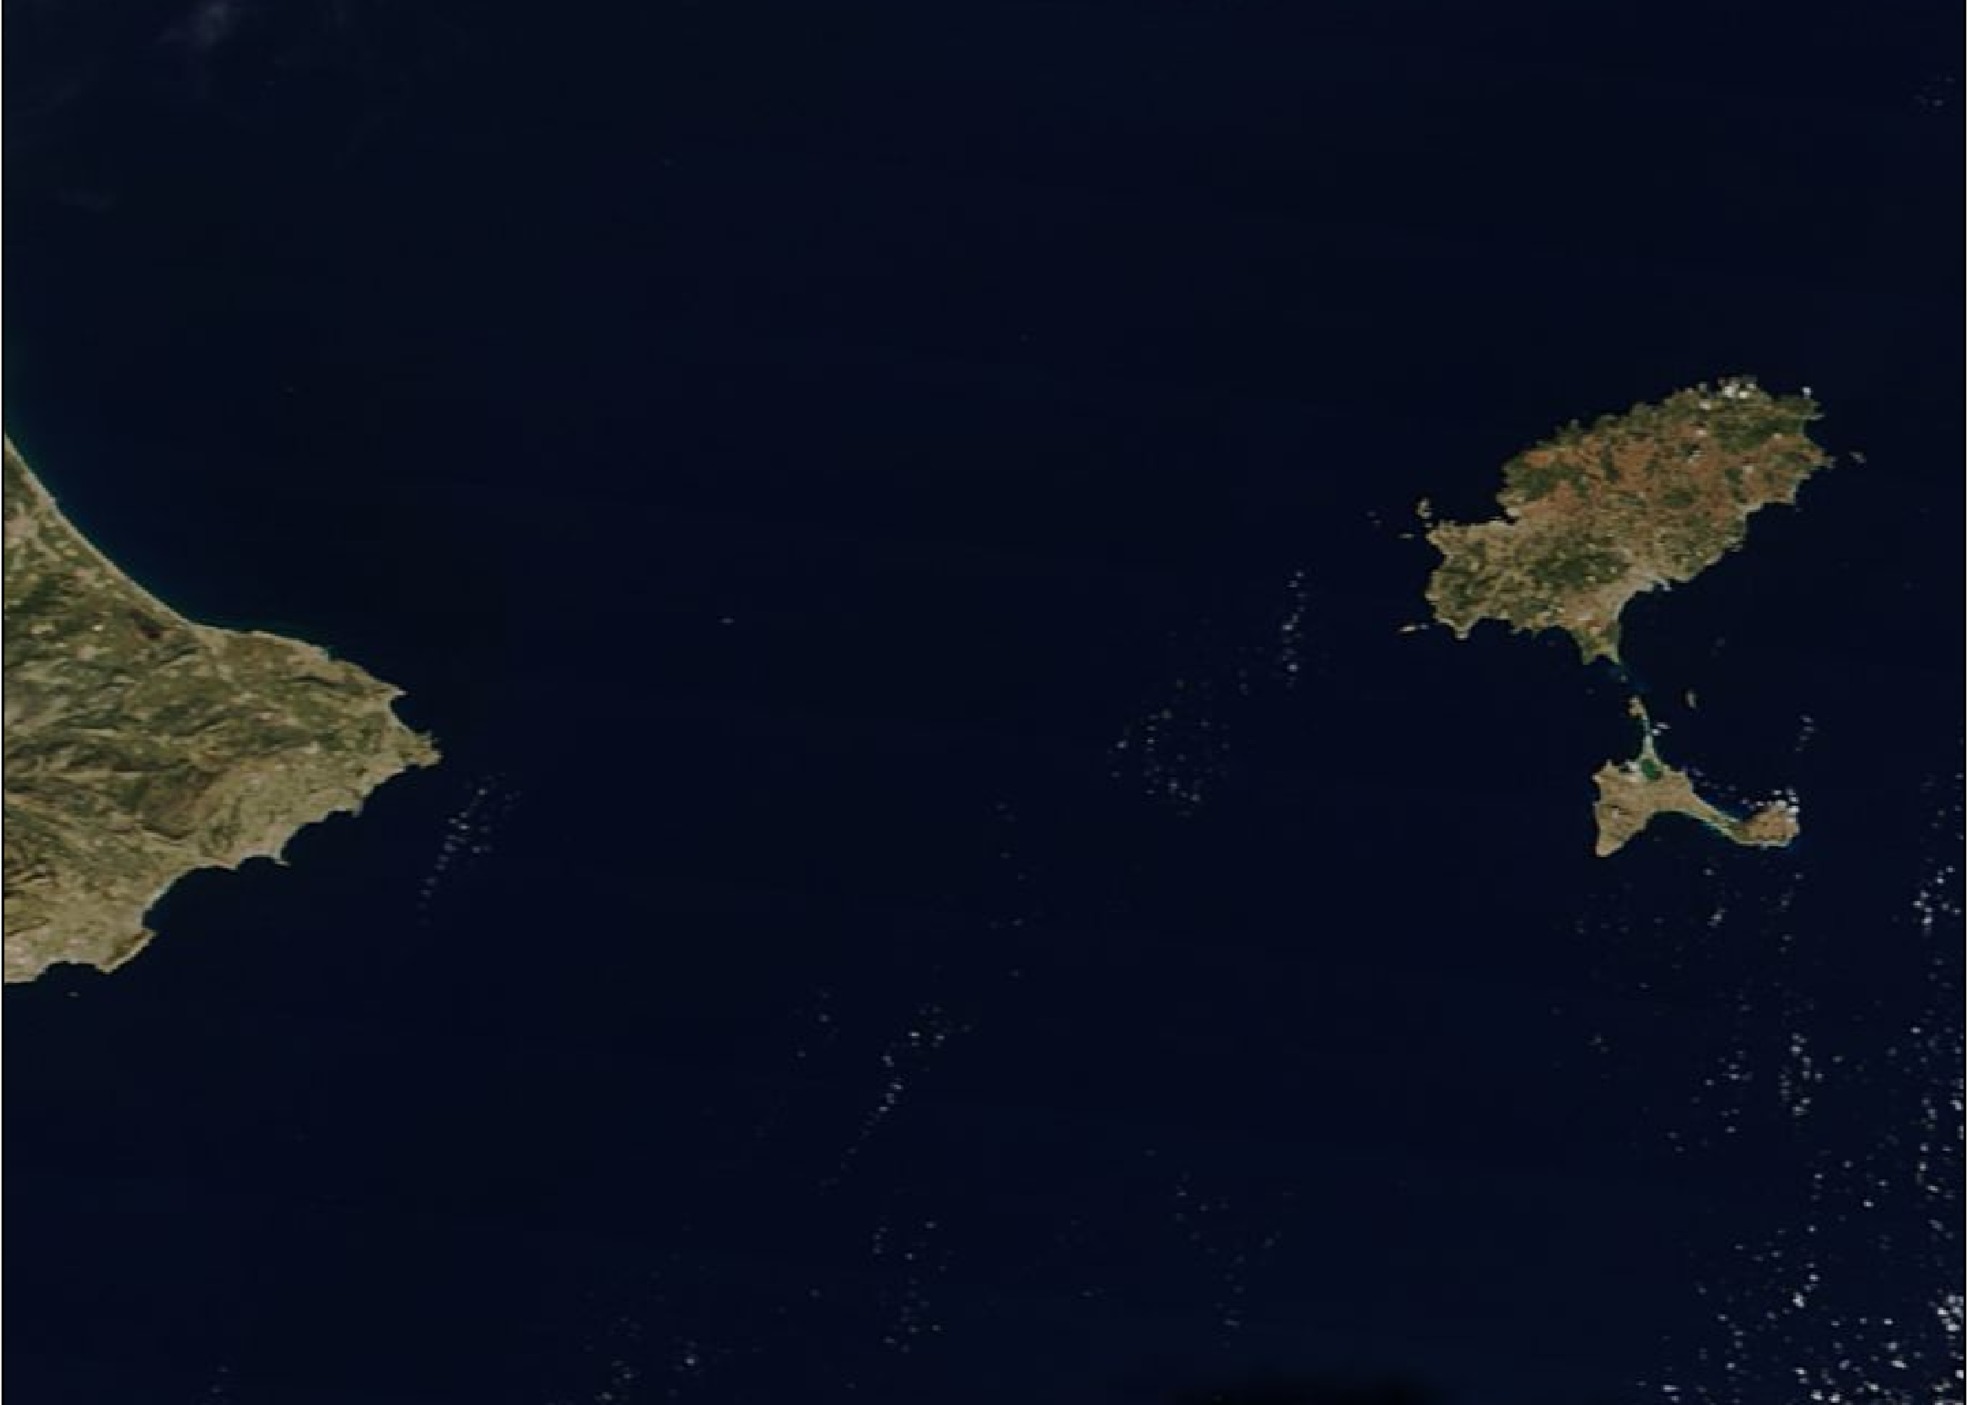
The background image is taken from NASA WorldView, the dominant dark tone was chosen in order to fit with the presentation template.


