MEDESS-GIB drifter trajectories
The authors needed an illustration showing the drifter trajectories and the main oceanic structures as an overlay.
Concept
In addition to the trajectories, the sea water temperature measured by the drifters can also constitute a relevant information.
Realization
For the temperature scatter plot, a diverging color-map is selected to highlight the contrast between the cool Atlantic Water and the warmer Mediterranean Water.
The Western and Eastern Atlantic Gyres (names WAG and EAG) are represented as circle in projected coordinates. The arrows are added as a small segment of the circle annotated with a specific arrow style.
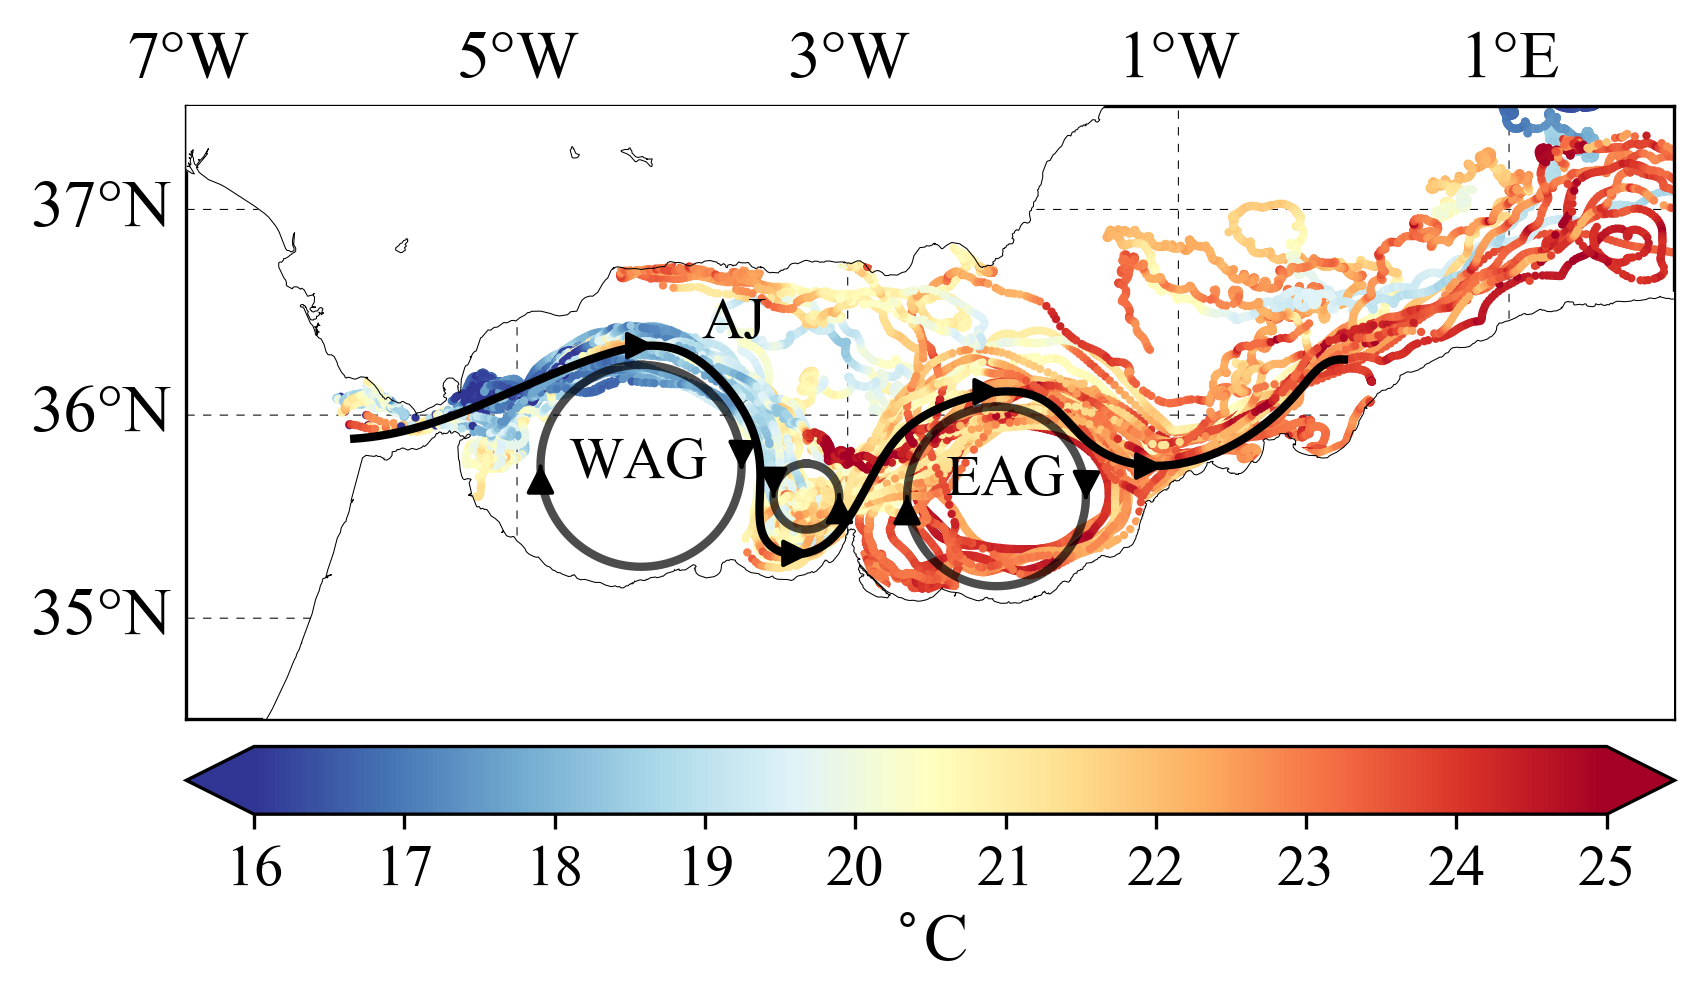
The Atlantic Jet are designed in 2 steps:
- with a click-and-save technique: the coordinates of a series of points are captured and stored in an intermediate file;
- a spline function is applied on the coordinates to obtain a smooth line.
Tools
The Python module is called pickpoints. While it worked when I prepared the figures for the paper, I could not make it work with the latest version of python
```python import pickpoints import numpy as np
points = test_pick_point.pic2data(‘/data_local/Publis/20150528_MedGib/figures/1-s2.0-S0079661113001080-gr1B.jpg’)
points = test_pick_point.pic2data(‘/data_local/Publis/20150528_MedGib/figures/’ ‘Medgib_SST_medium_domain_currents2_reversed.png’) np.savetxt(‘/home/ctroupin/Publis/20150528_MedGib/python/AtlanticJet2.dat’, points)