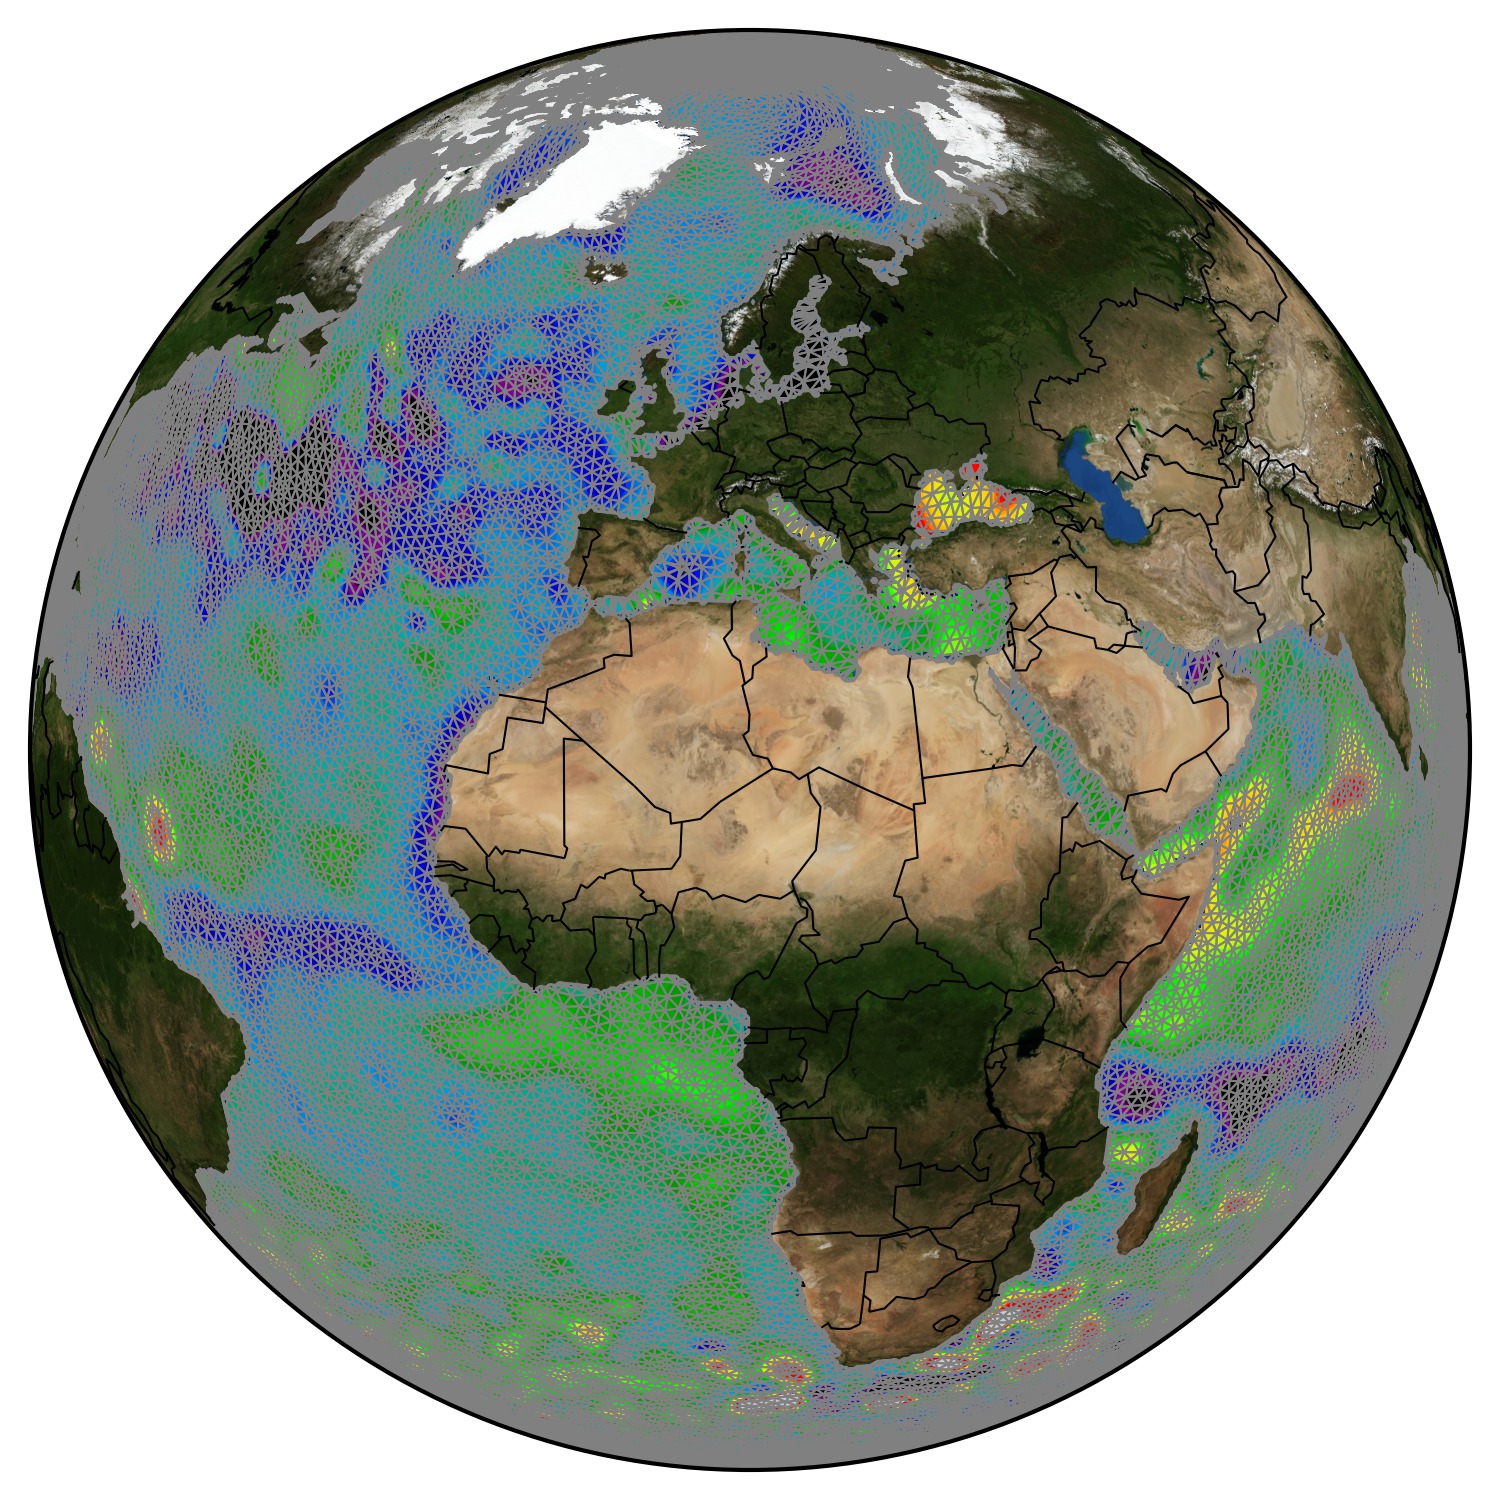
Global map of sea level anomalies
The figure was specifically created for a scientific meeting in Boulder: we were happy to be able to generate such global maps by interpolating more than a million data points using with the DIVA software tool, in just a few seconds. And we wanted to show it.
Concept
The sea level anomaly field obtained with DIVA is shown on a sphere, along with the finite-element mesh used in the interpolation process.
The background image is a geoTiff file obtained from the NASA Earth View web.
Afterthoughts
Interestingly the audience response was rather neutral or even unhappy, since other methods were preferred, even if they took hours instead of seconds.