Data interpolation
09 July 2018
Leaflet, DIVA, LaTeX
The idea came for a conference in which we had to present a spatial interpolation technique to a public not very familiar with the topic. As usual, putting a lot of equations was discarded.
We decided to come up with a map with different layers, each layer corresponding to a step in the interpolation process.
The storyline
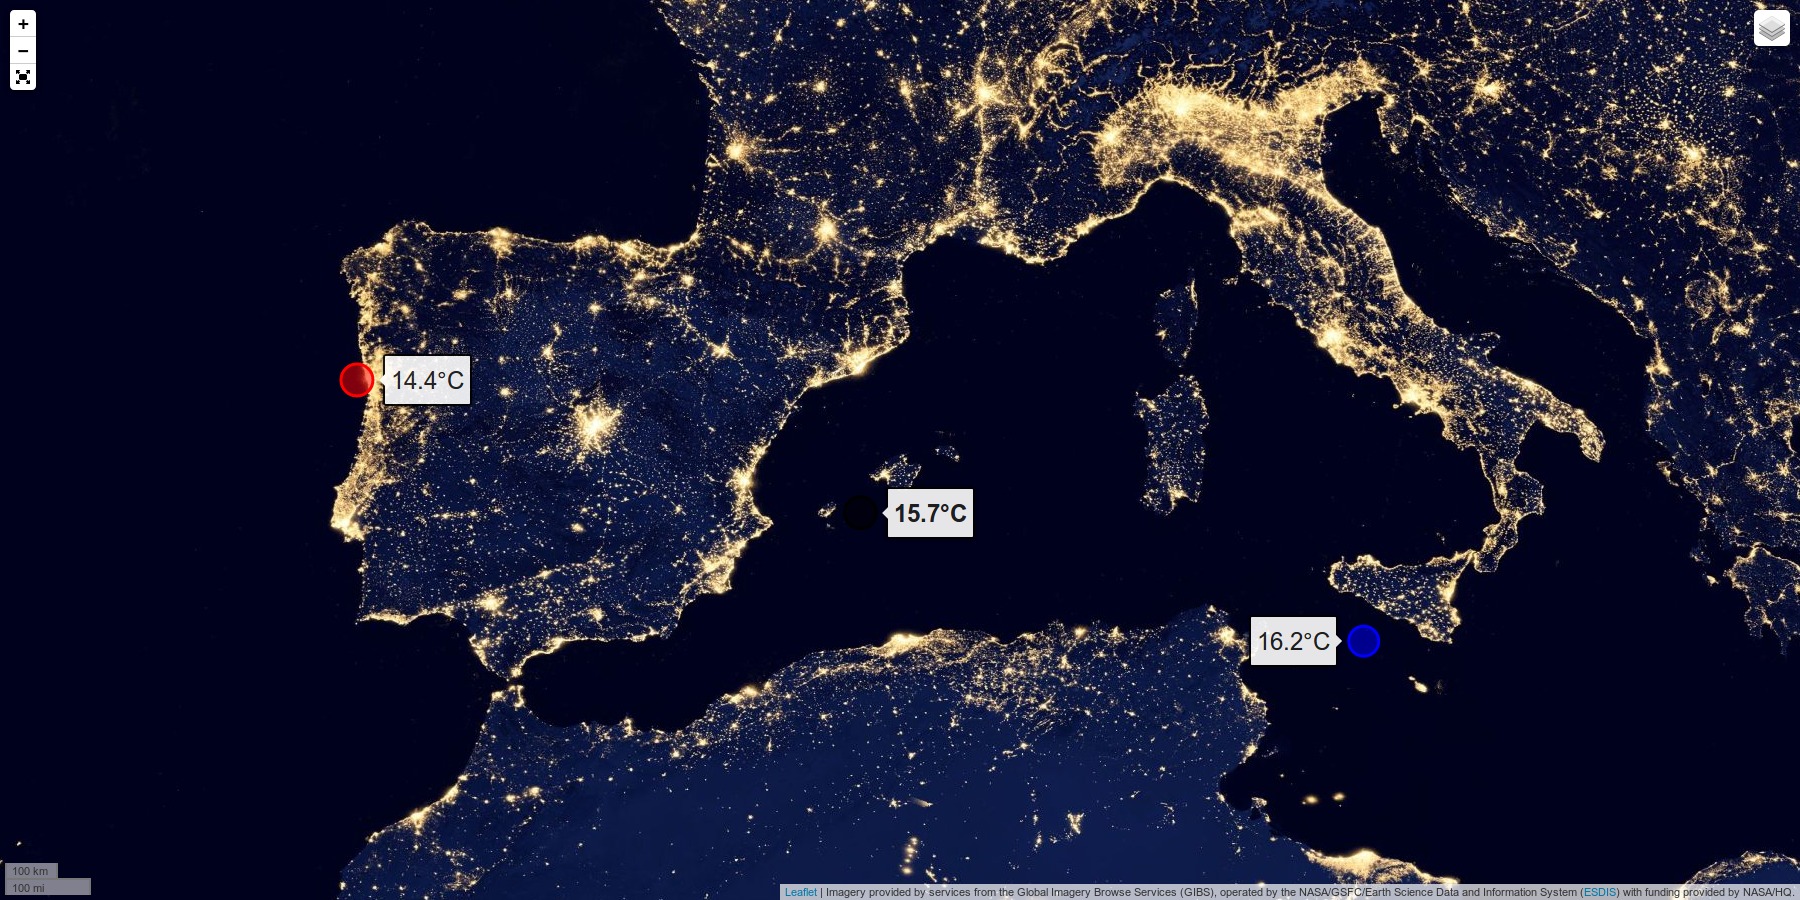
We start by a question: given the sea water temperature in Porto (the meeting place) and in Malta, what is the temperature near Ibiza (halfay)?
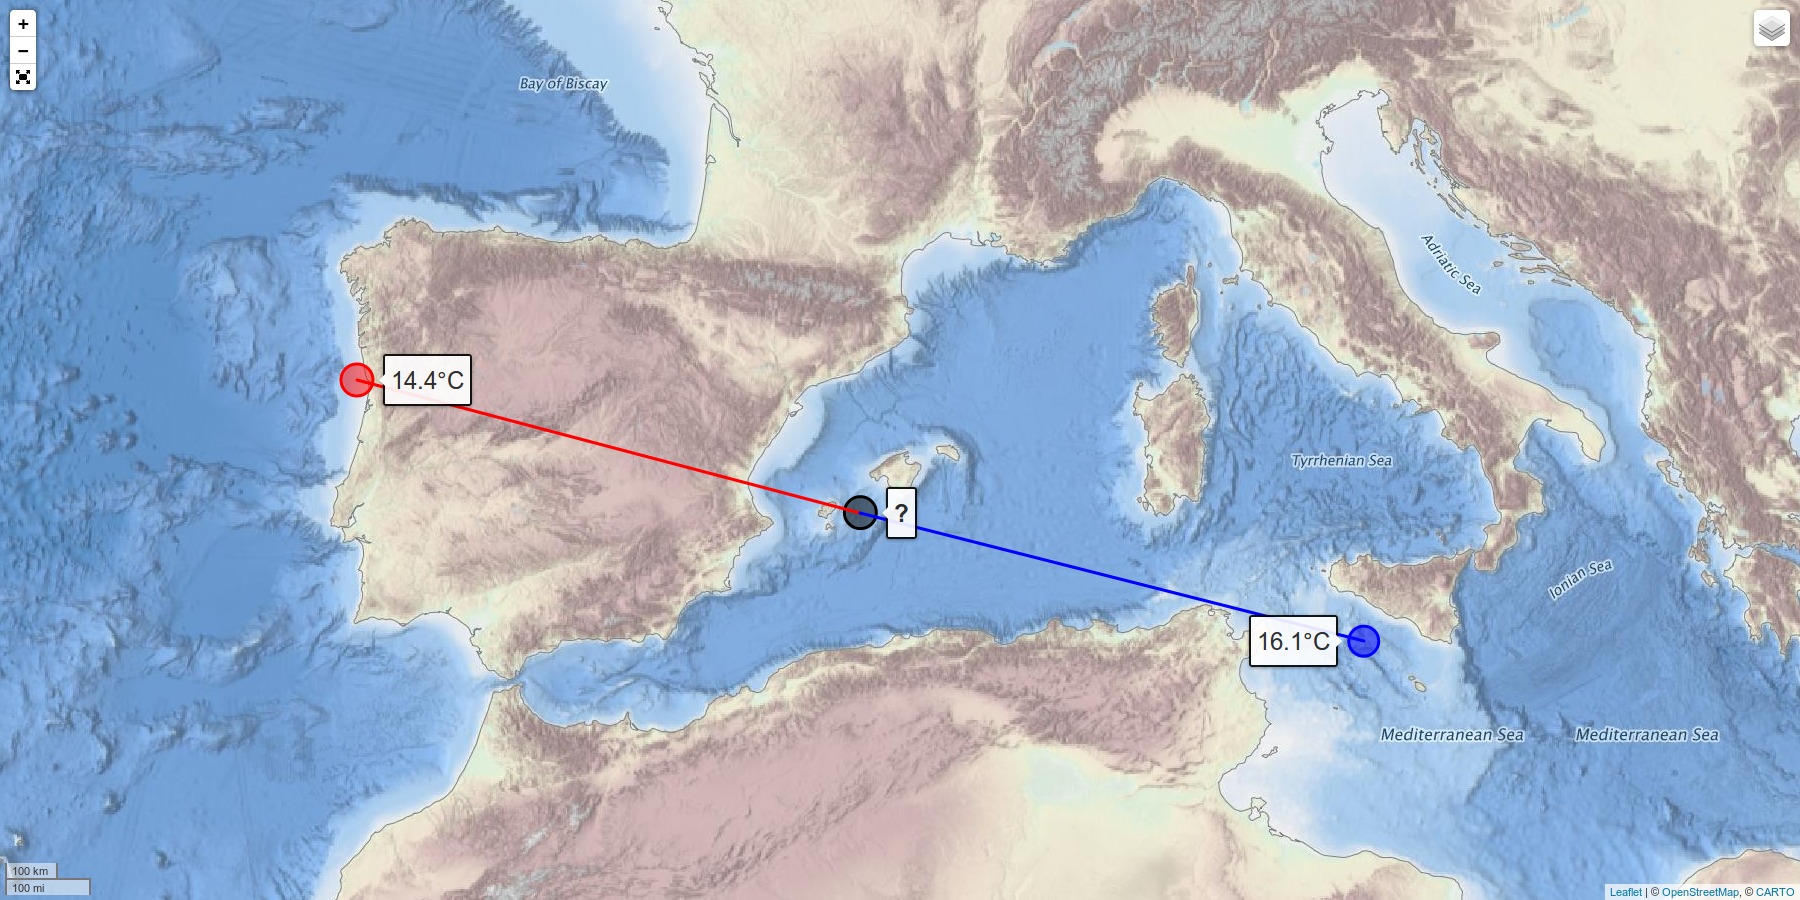
The easy answer is the mean value, but of course it is not as simple:
- there are uncertainties and noise on the measurements,
- the different places are separated by land, so the problem is anysotropic,
- there are currents and other processes in the ocean that make things even more complex.
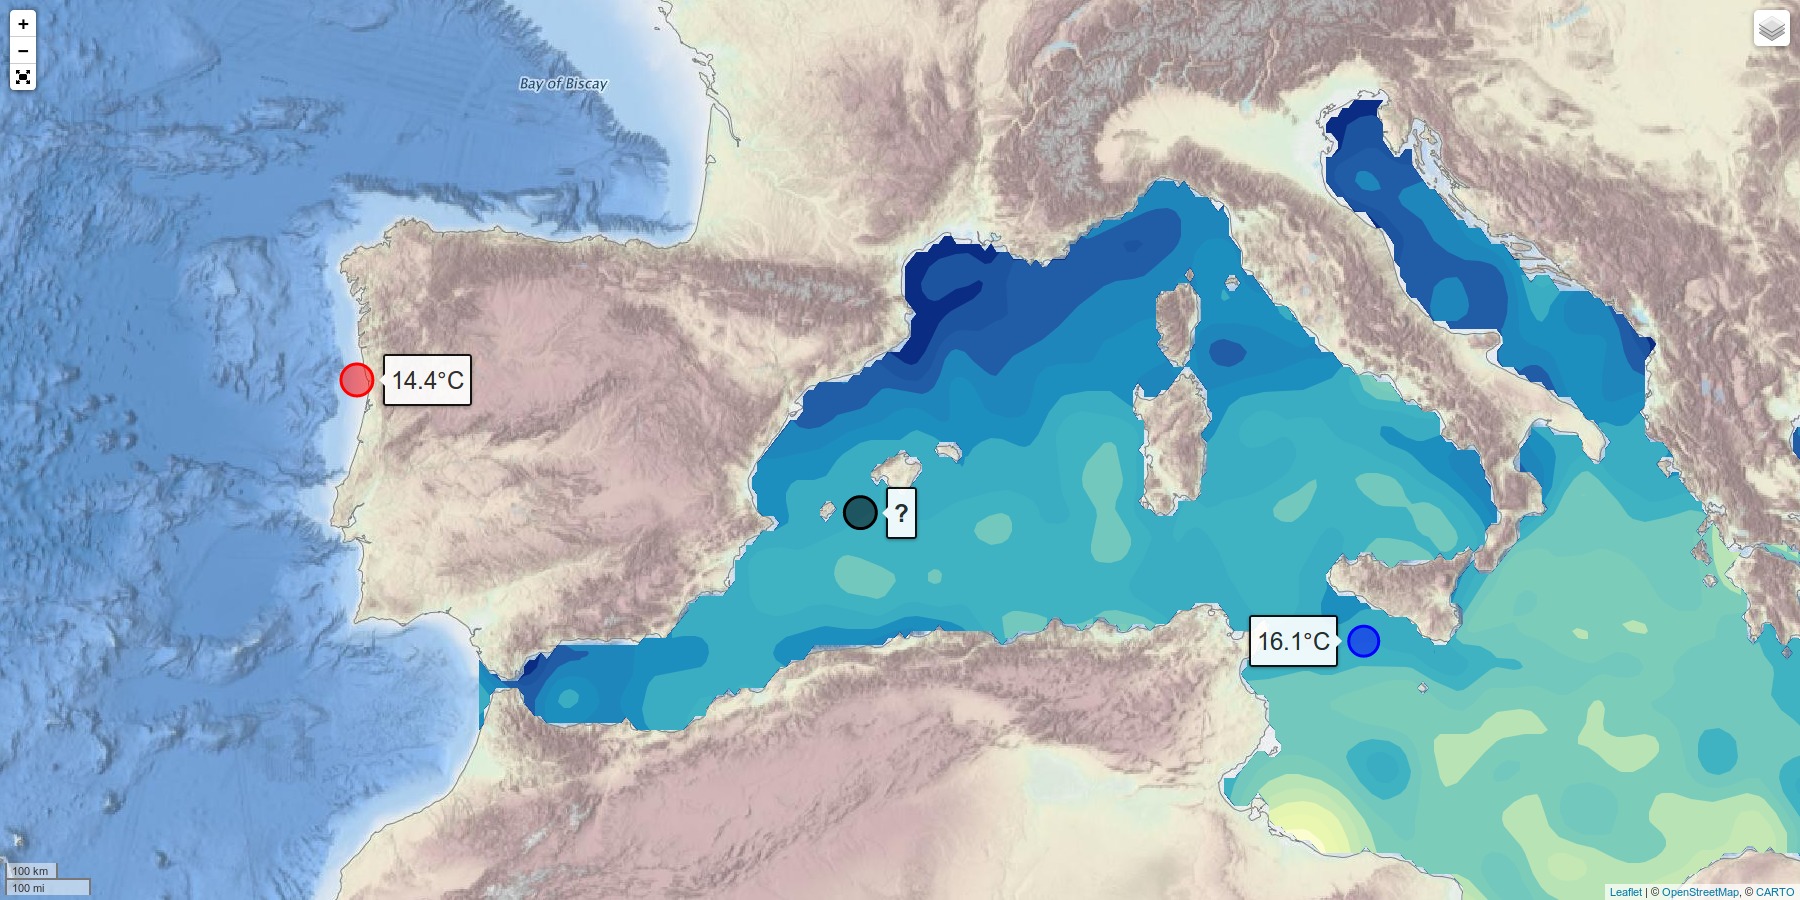
The interactive map
Just play with it!
Afterthoughts
Ideally I would have presented the map directly, but I that time I was not sure it was going to work so instead I prepared screen-shots of the different layers.