Running in Mallorca
01 March 2017
Leaflet
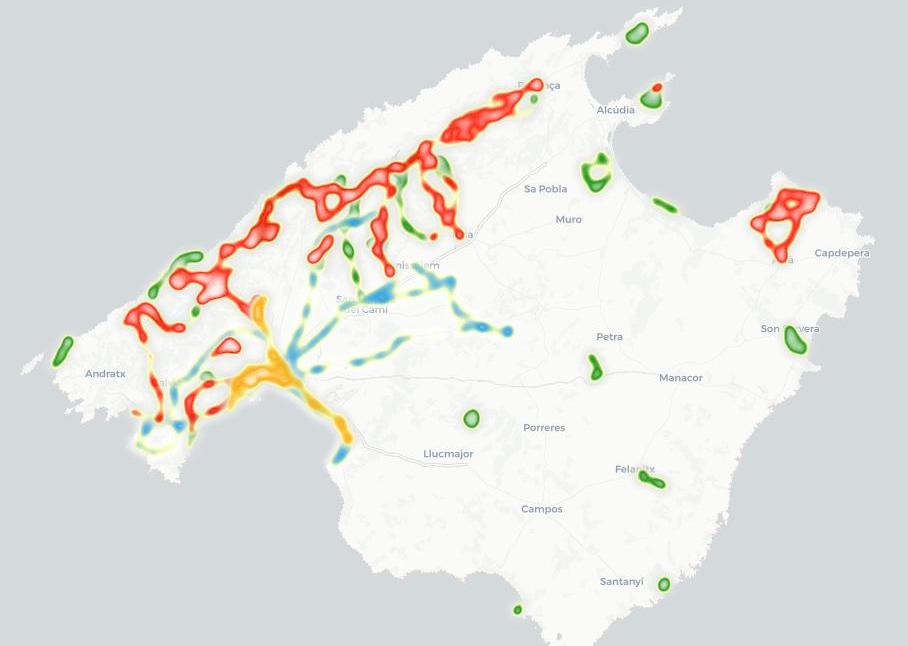
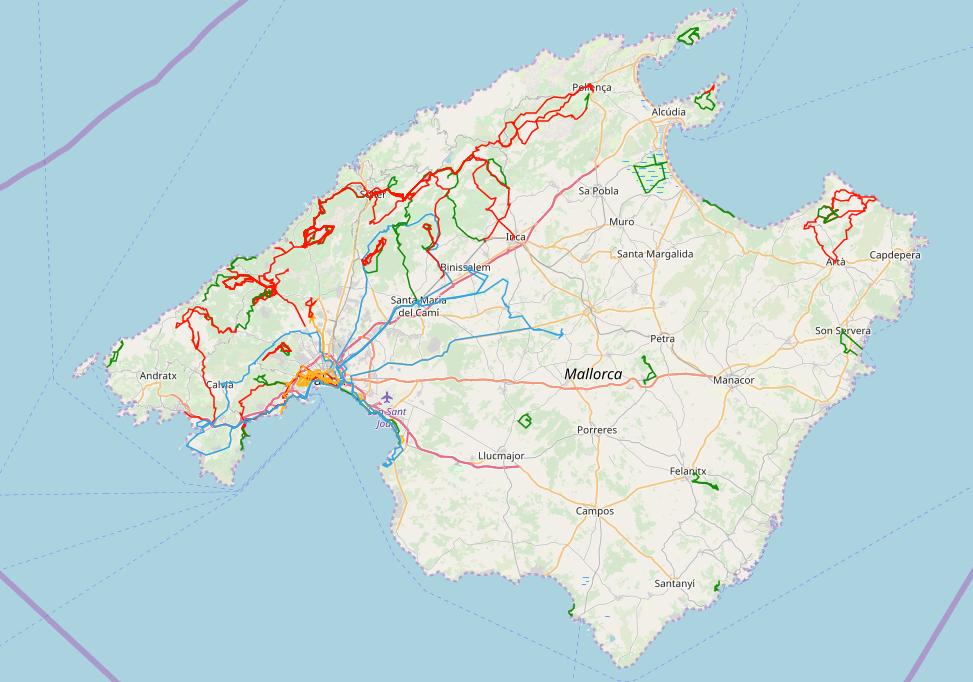
When I was working in Mallorca, I used to organize trekking in the Tramuntana and after a while I though we could have a visual summary of what we did, in the form of an interactive map. Leaflet was very popular where I was working, hence that was the natural choice. We then added other types of activities: trail running, bike, …

Pre-processing
The GPX files downloaded from Movescount are a bit heavy, for example a track of about 9500 points is stored in a 4.5 MB file. This is because the files not only store the time and coordinates, but also the cadence, distance, altitude and speed. It’s straightforward to remove that information (since we won’t use it) with a bash script using sed commands for instance.
For the same file with the 9500 points, we end up with a new file of 1.3 MB. Finally, as we’re not interested in having a high precision representation of the tracks, we re-sample them to 500 points. This turns out to be enough to properly display the tracks and at the time to have correct values for the total distance and the ascent. gpsbabel is very good for this kind of operations.
Implementation
The list of GPX files is stored in a simple file like this:
var run = [
  "run/es-molinar-son-espanyol.gpx",
  "run/es-molinar-palma.gpx",
  ...
]
When we need to add a new activity, we just have to update the list and add the corresponding file.
The line color depends on the type of sport: hiking, cycling, running… this information is not explicitly present in the GPX files so we simply add it as a keywords tag, for example:
<keywords>Hike</keywords>
Another solution could be to derive the type of sport from the data, for example computing the mean velocity, the distance, … but we prefer to keep it simple, especially considering that some running tracks have very long distances that could mislead the classification. Well, in other words: I didn’t want to implement that.
The map
Just click on the image below.
Every time I look at it, I think: there is still a lot to explore!
