Sea water temperature in Mallorca
03 August 2018
Python, Thredds, API
Oceanography, Balearic Islands
Recently there was an article in the newspaper El diario de Mallorca where they were talking about the water temperature around the Balearic Islands, as it seems they reached very high values for this time of the year. Let’s have a look at that.
Data
The SOCIB maintains several mooring around the islands, the
one we will use is located in the Bahía de Palma and provides data since 2014.
The data can be downloaded in netCDF format, but it is not necessary to download everything
since there is a possibility to access the information using the OPEnDAP protocol.
Tools
When I was working there I wrote some python code to read and plot this kind of time series, I kind of did it on a rush, so it’s not the cleanest code I’ve seen, and probably it is necessary to edit it a little bit…
By the way, all the plotting tools are available in this GitHub project:
Creating the plots
It turns out that the adaptation of the script was not too bad:
- update of the file list,
- setting of the X-axis limits,
- cosmetic changes: adaptation of the legend position, modification of the text font, removal of the SOCIB logo.
More of less 10 minutes of work, the bad part being the monthly file list: the file URL doesn’t not only depends on the year and month, but also on the deployment number and the ID of the platform. Sometimes they have to replace the sensor and this is reflected in the metadata and the file name. Anyway, that kind of issues for the data user should be overcome by the deployment of new Data API.
What do we learn?
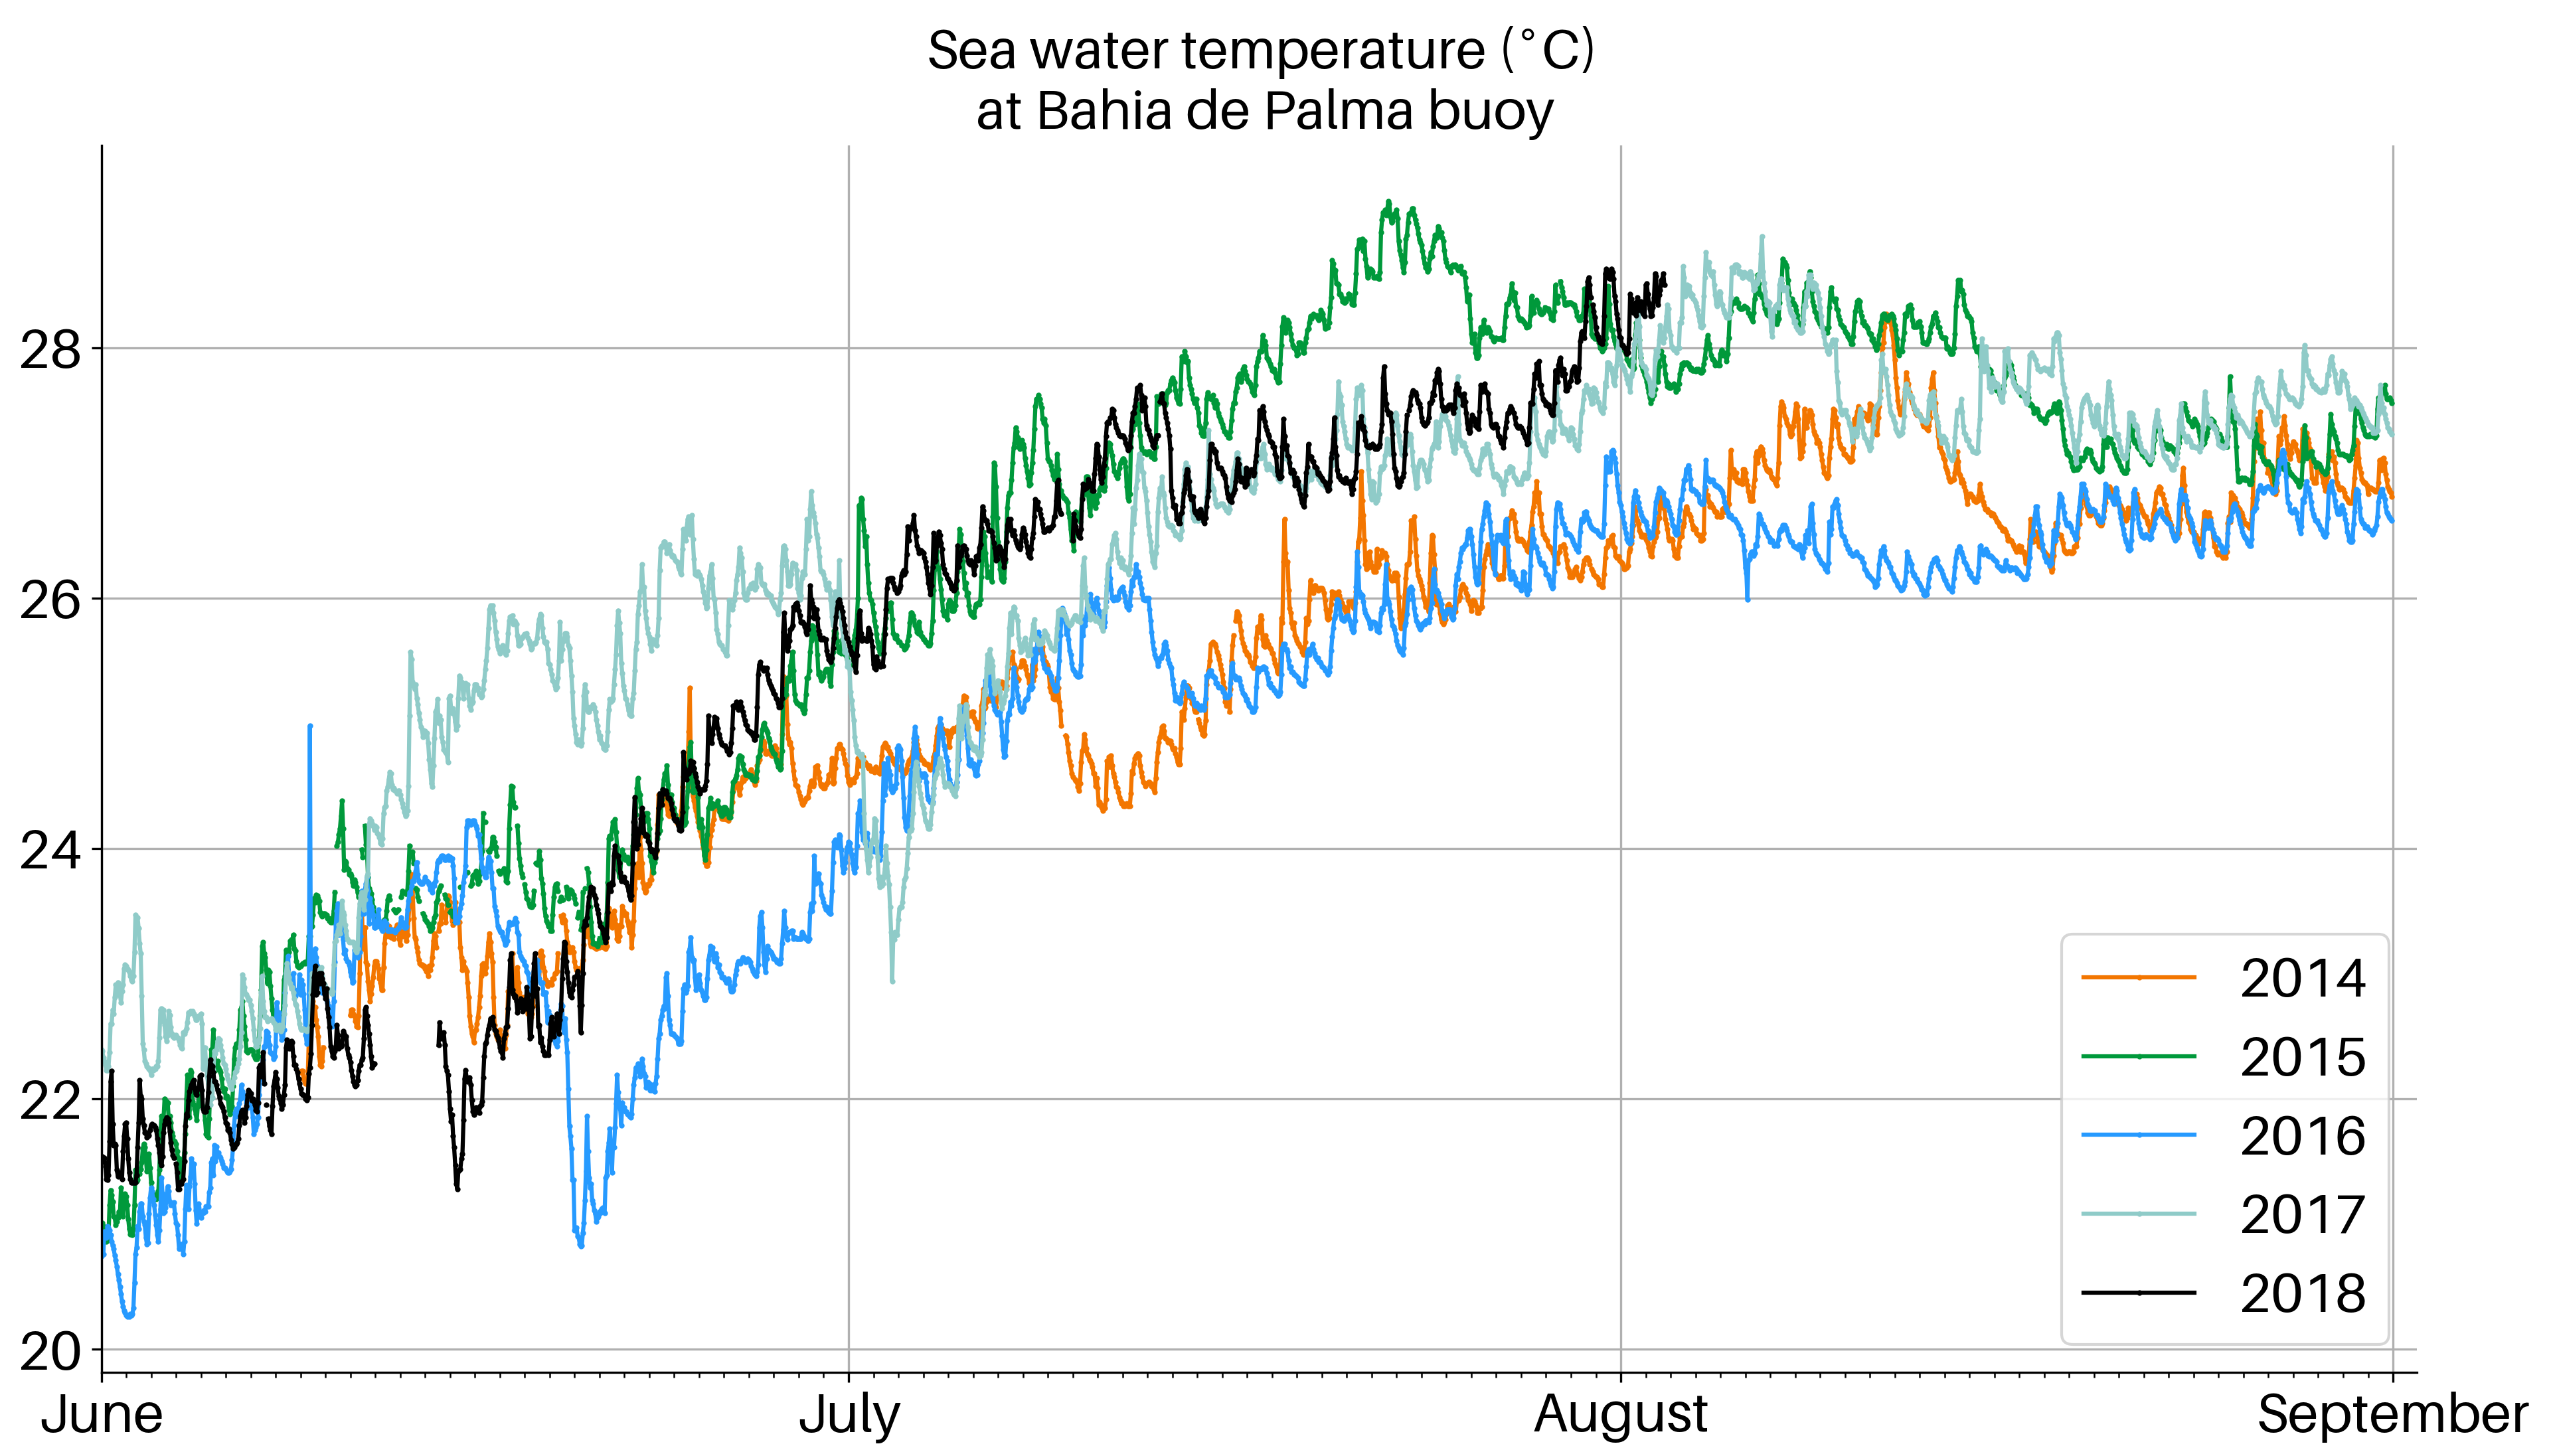
So here we are, the comparison of temperature from June to September, between 2014 and 2018. Many things may strike in the time series:
- The very high values observed in late July 2015, almost 30°C.
- The sharp decreases for example in June 2016, July and September 2014.
- Despite the strong variations in summer, the temperatures end up between 26.5 and 27.5°C by the end of September.
We see that the present temperatures are at the same level as in 2017, but that doesn’t mean that the rest of the season will follow this tendency, as some events may provoke an abrupt decrease of temperature in a matter of a couple of days.
What about the salinity?
As a bonus we also have the evolution of the salinity for the same period. It is not easy to interpret what happens in the signal as there is no clear pattern in the variable evolution.
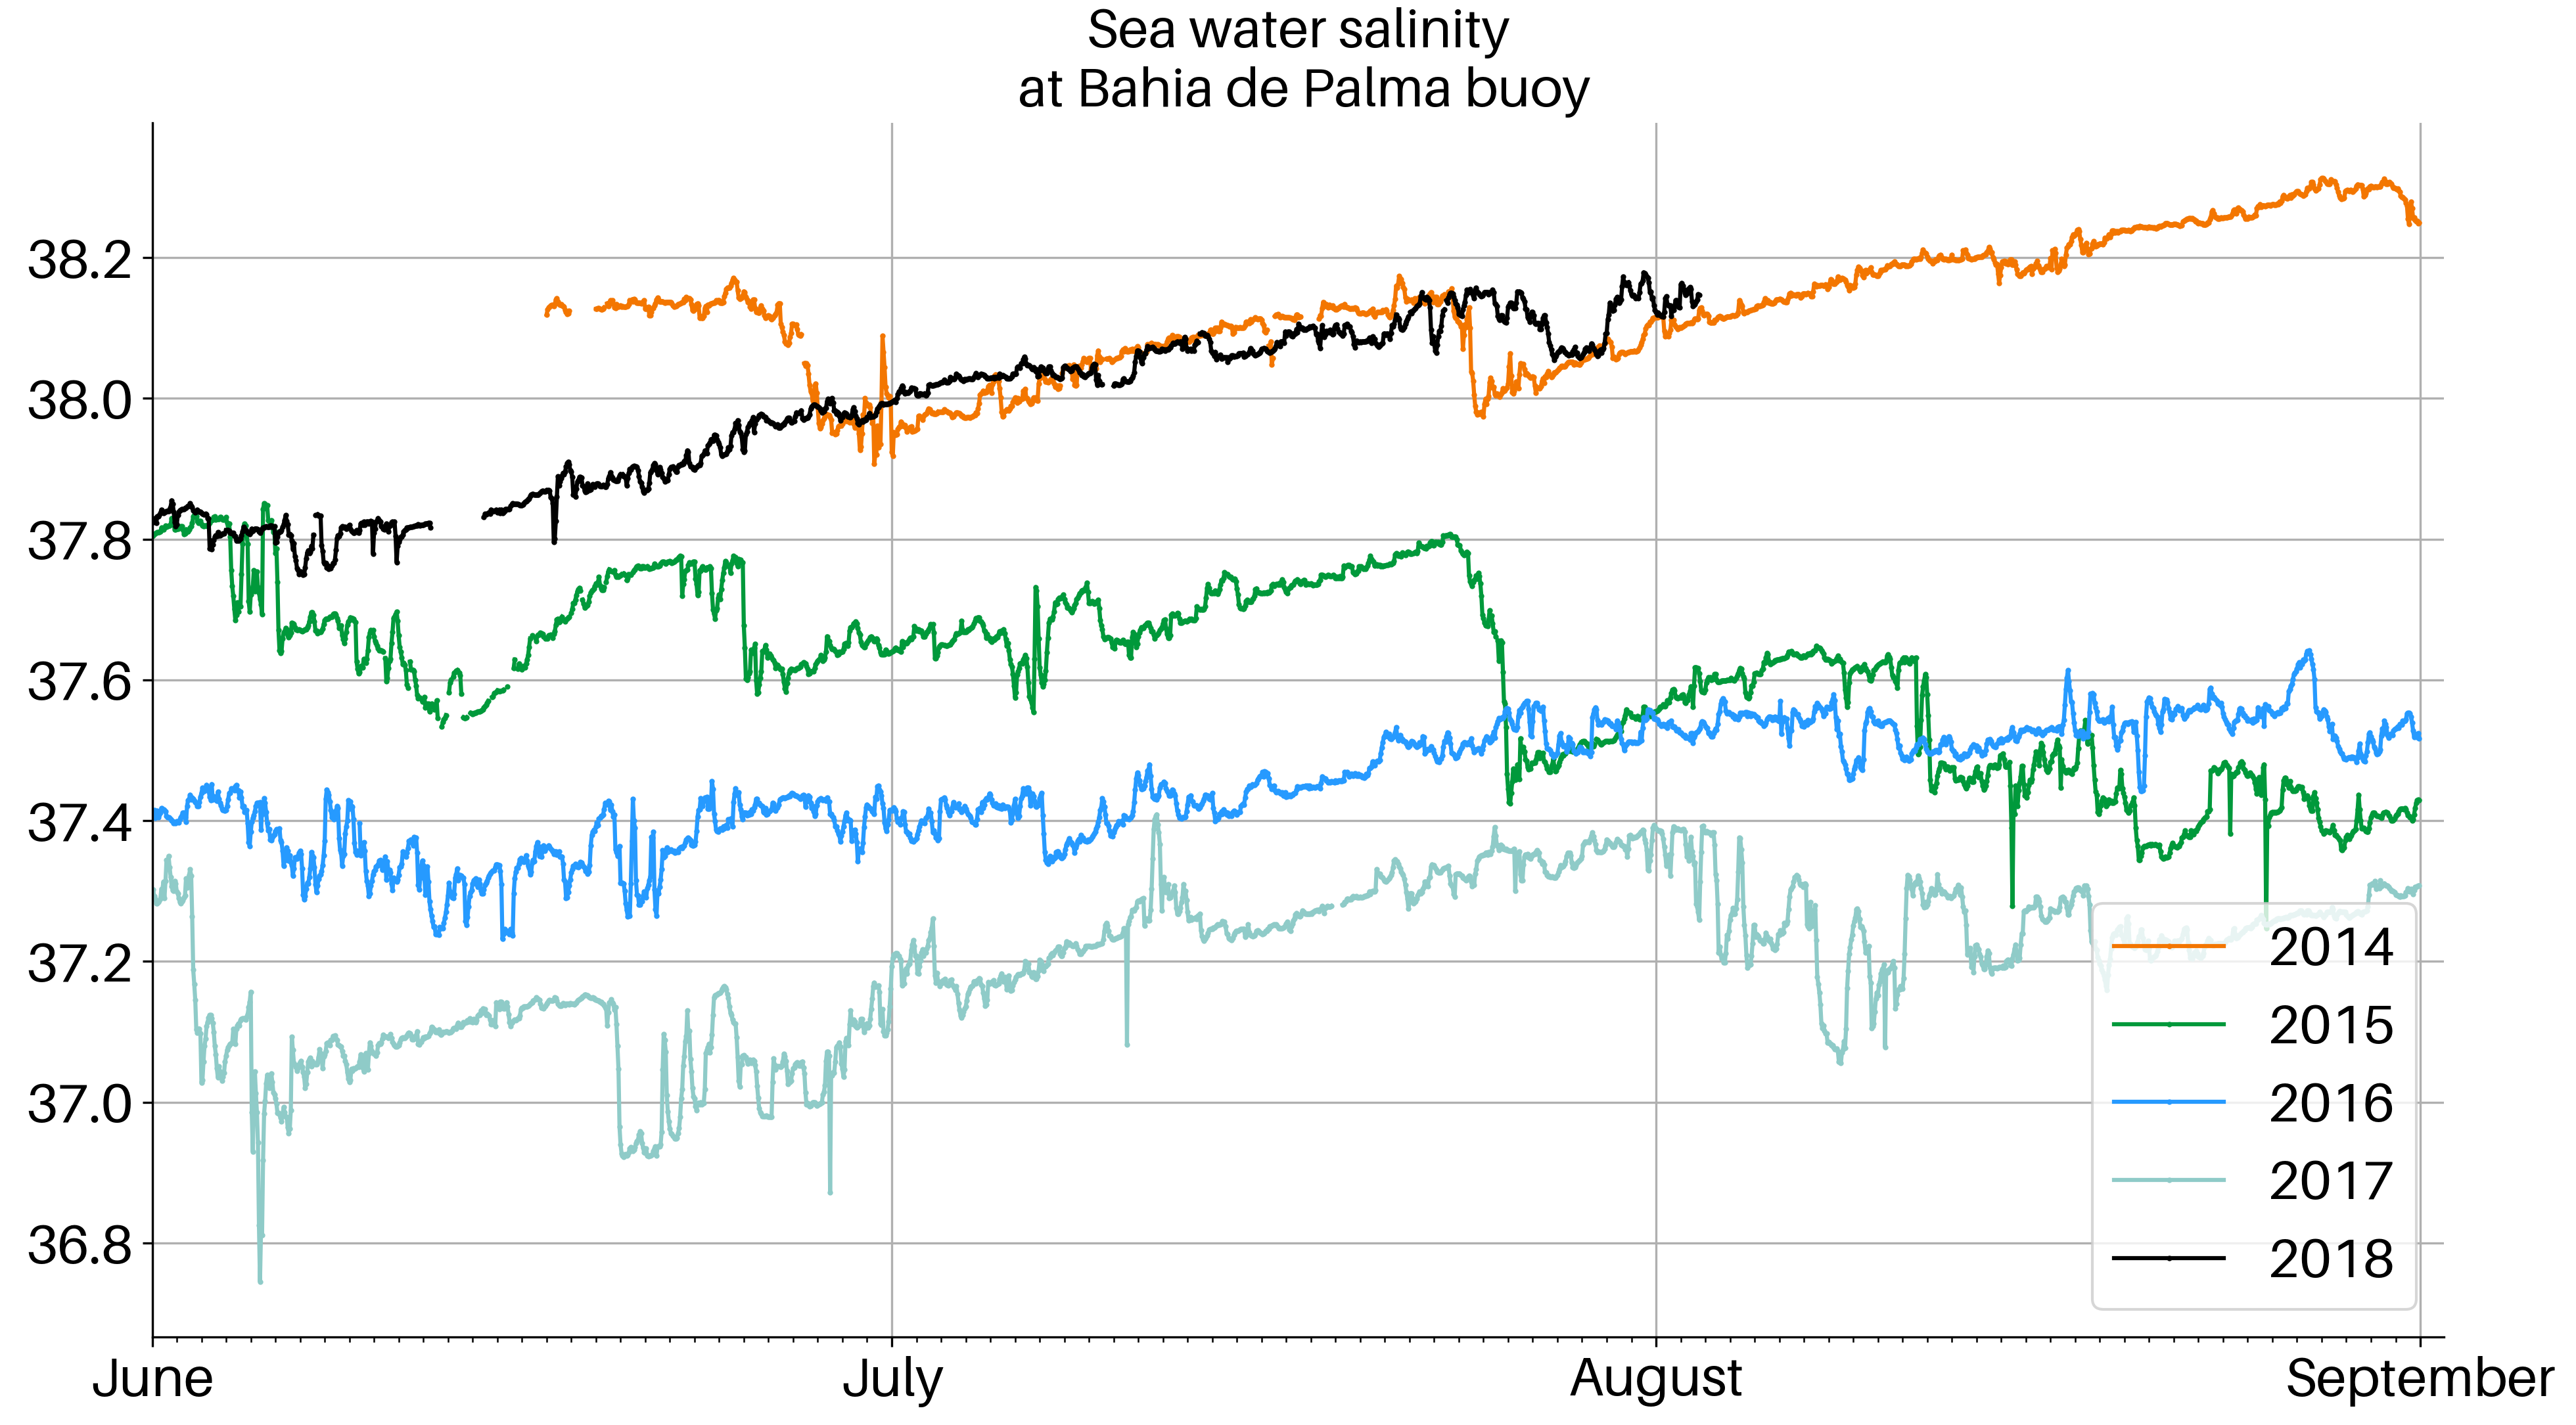
The most striking feature is maybe the higher salinity values in August measured in 2014 and 2018, between 38 and 38.2 PSU, while the salinity situated around 37.2-37.4 in 2017. The differences might have a physical origin for instance the presence of different water masses or a stronger imbalance between evaporation and precipitation. Or the origin may come from the instruments themselves, their calibration was maybe different.
Whatever the reason, it’s something that deserves a particular attention and comparison with other sources of information such as satellite images or numerical models.